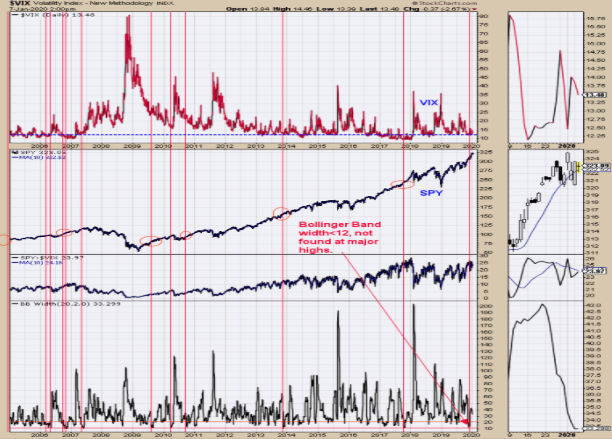
A pull back in the SPX may be near. However, the potential consolidation may be shallow. The Bollinger® Band width of the VIX less than 12 have lead to minor consolidations in the SPX and none where found at significant highs (going back 15 years). The recent Bollinger® Band width of the VIX low came in at 11.51. Sold Long SPX on 12/24/19 at 3223.36= gain 1.72% Long SPX on 12/13/19 at 3168.80. Follow us on twitter. @OrdOracle

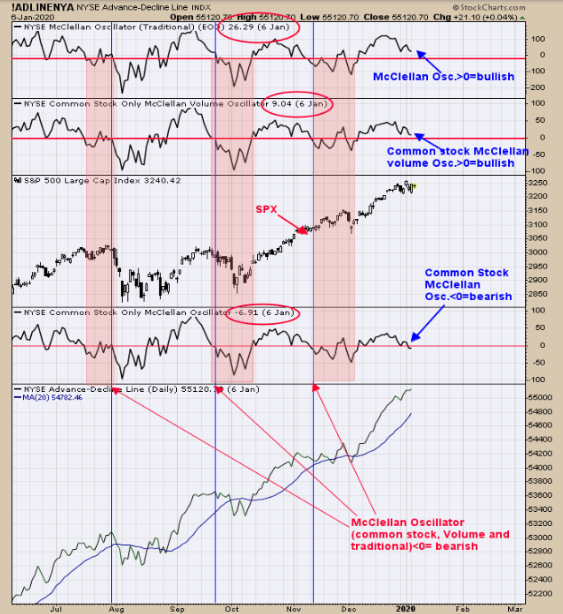
The top window is the NYSE McClellan Oscillator. Readings above “0” are bullish and below bearish (closed yesterday at +26.29). Next window down is the NYSE Common stock only McClellan Volume Oscillator; readings above “0” bullish, below bearish (Yesterday’s close was +9.04). Fourth window down from top is the NYSE Common stock only McClellan Oscillator which closed yesterday at -6.91 and in bearish territory. As of yesterday’s close, two of the Oscillators are above “0” (bullish) and one below “0’ (bearish). So at the momentum according to the Oscillators, the lean is still bullish but this can change quickly. At best the market may trend sideways and at worst is a test of support near 3075 SPX. Don’t see a safe setup. Join us on twitter. @OrdOracle.

The top window is the 10-day average of the Bullish Percent index for the Gold Miners index. The Bullish Percent index measures the percent of stock in an index that are on Point and Figure buy signals. The 10-day average of the Bullish percent index above 40% predicts the index is in a bullish move. The current 10-day average of the Bullish percent index for the Gold Miners Index stand at 80.42. The rally in the Gold stocks appears to have further to go. The next resistance for GDM (Gold minders index) is near 1100 which corresponds to 37.50 range on GDX (NYSE:GDX). Long GDX on 1/29/19 at 21.97. New Book release "The Secret Science of Price and Volume" by Timothy Ord.
