- SPX Monitoring purposes; Neutral
- Monitoring purposes Gold: Long VanEck Vectors Gold Miners (NYSE:GDX) at 18.72 on 8/17/18
- Long-term Trend SPX monitor purposes; Sold long-term SPX 7/16/18 at 2798.43= gain 2.95%; Long 6/29/18 at 2718.37.
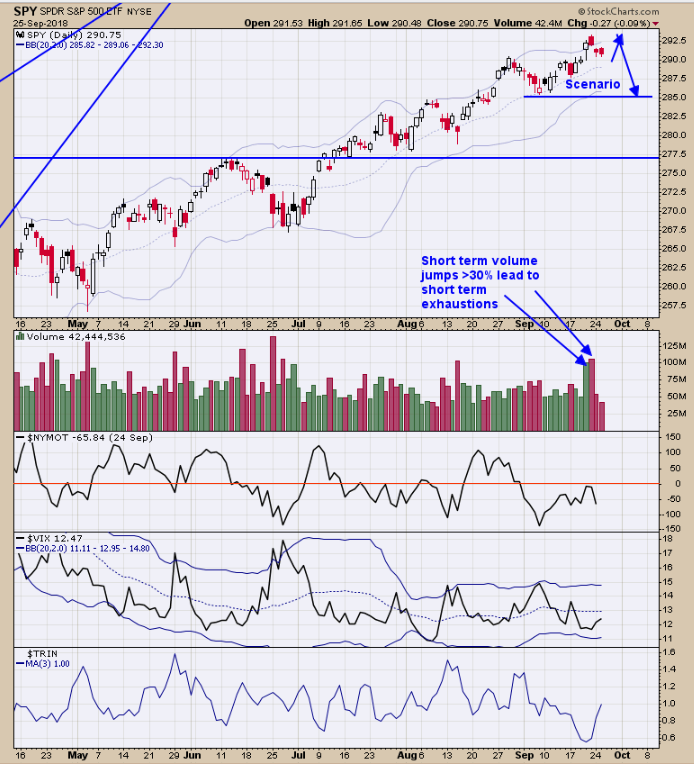
Thursday and Friday of last week, the Volume on the SPY (NYSE:SPY) jumped over 30% from the previous day volume which implies short term exhaustion to the upside. Friday’s volume was higher than Thursday’s volume and most high volume highs are tested, suggesting that Friday’s price high will be tested again. The DIA was higher four days in a row going into last Friday, the SPDR Dow Jones Industrial Average (NYSE:DIA) closed higher at least once in the next five days 81% of the time. This condition suggests last Friday high will be tested again with a probability of 81% . The McClellan Oscillator remains below “0” and a bearish sign. The FOMC meeting announcement could produce the next setup. Follow us on twitter. @OrdOracle.
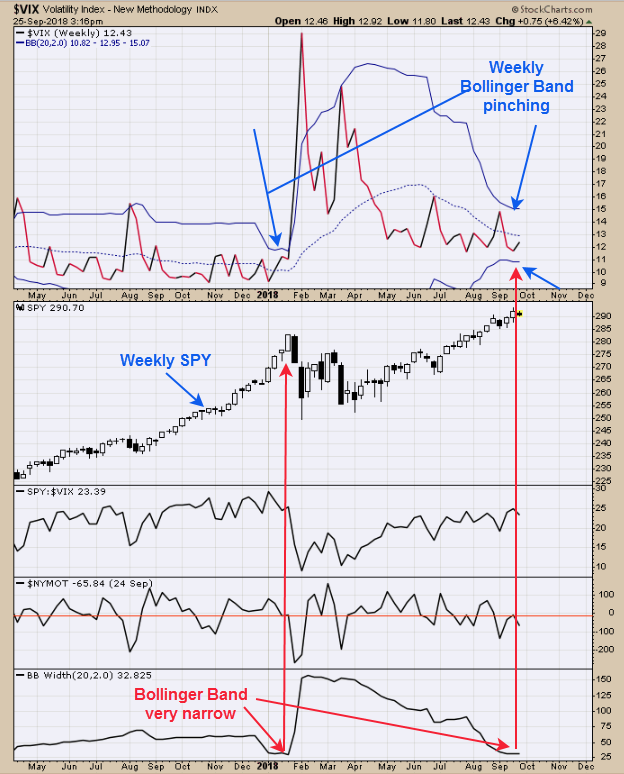
Above is the weekly VIX with its Bollinger® band. The Weekly VIX Bollinger band is pinching suggests a large move for the SPY is not far off. The bottom window is the “Bollinger Band Width” which is at its lowest point since January. The January period produced the biggest decline for this year thus far. If market does bounce and test Friday’s high a sell setup could form. Also remember, “market has been down 6 days in a row going into September 7 and the market been lower 10 of 12 times (83%) on average of 3% over the next 30 days”. FOMC meeting may have an affect on the market. Still neutral for now.
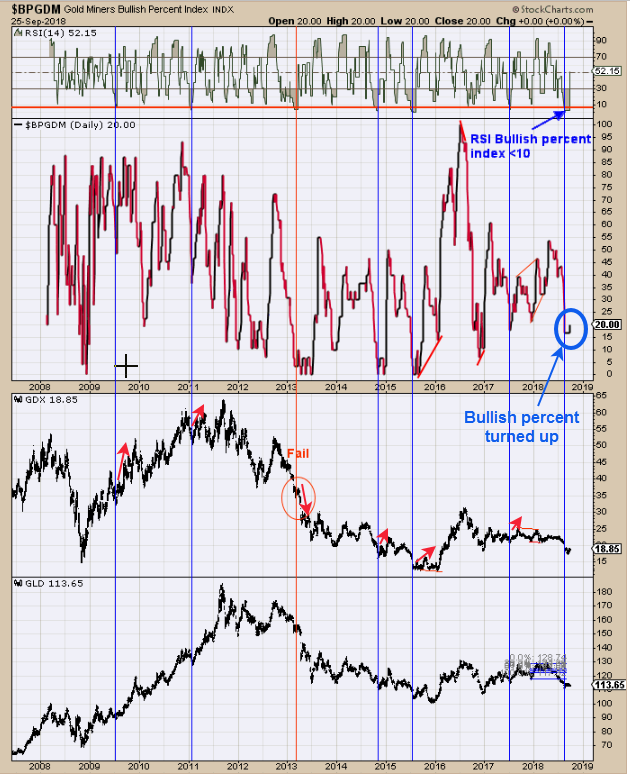
We posted this chart about a month ago. What it is is the RSI of the Bullish percent index. The Bullish Percent index measures the percent of stocks in the Gold miners index that are on point and figure buy signals. Worthwhile lows have formed when the RSI of the Bullish Percent index reaches below 10. This chart goes back to mid 2007 and shows the times when the RSI


