- SPX Monitoring purposes; Sold long SPX on 2/26/18 at 2779.60= gain 2.33%; long 2/20/18 at 2716.26.
- Monitoring purposes Gold: Neutral.
- Long-Term Trend SPX monitor purposes: Long SPX on 2/8/18 at 2581.00.
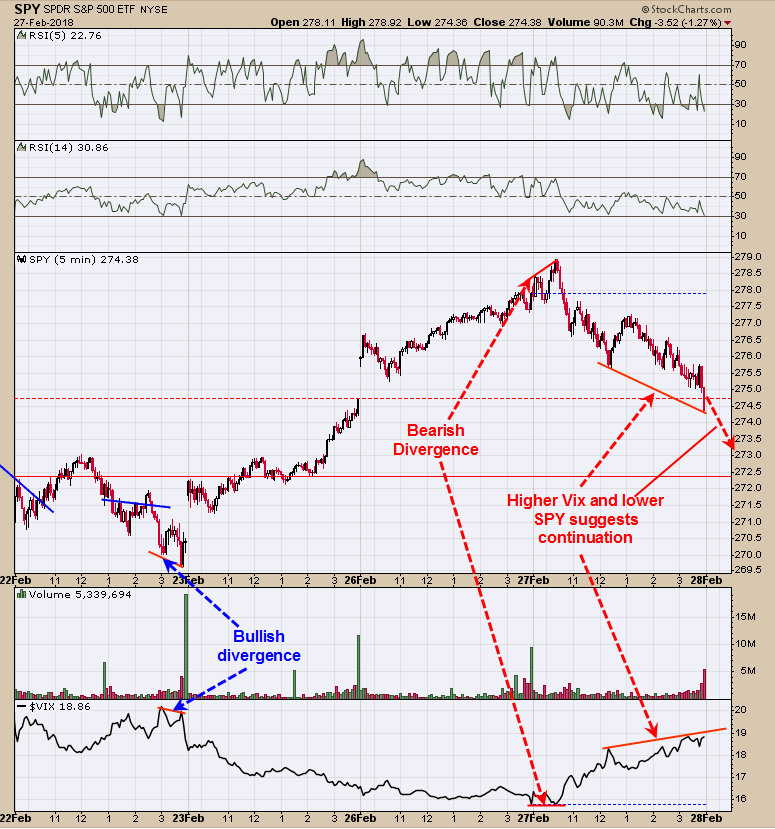
The above is a 5-minute chart of the SPDR S&P 500 (NYSE:SPY). Thought the TRIN and Ticks did have a bullish combination today, suggesting a bounce is coming, the VIX suggests the pull back is not complete. As the SPY fell today the VIX worker higher suggesting the pull back in the SPY is incomplete. On the above chart we pointed out the VIX and SPY divergences where a low and high have formed on the SPY. It will be a bullish sign for the SPY when the VIX starts to make lower highs as the SPY makes lower lows. This divergence could show up in the next couple of days. Sold long SPX on 2/26/18 at 2779.60= gain 2.33%; long 2/20/18 at 2716.26. Sold long SPX on 2/15/18 at 2731.20 = gain 5.82%; Long SPX on 2/8/18 at 2581.00.
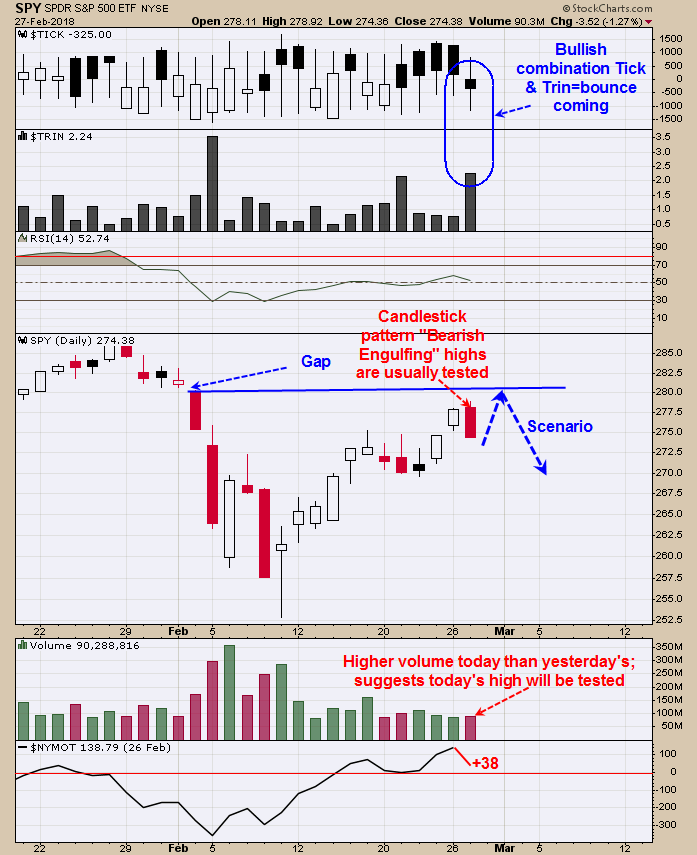
Today the TRIN and Tick closed at a bullish combination and suggests a bounce is coming that could starts as early as tomorrow or as late as Thursday. Today’s candlestick pattern was a “Bearish Engulfing” and a bearish sign for the market. We have found that most “Bearish Engulfing” patterns highs are tested at some point and suggesting today’s high will be tested soon. Today’s volume has higher than yesterday’s volume and high volume days are usually tested. SPY is not far from the gap level near 280 and most gaps are like magnets. The NYSE McClellan Oscillator closed above at +38 and most decline doesn’t start until the McClellan Oscillator is below “0”. Another rally could start later in the week that will test the gap level near 280 on the SPY. The 280 level could turn into resistance. Staying neutral for now.
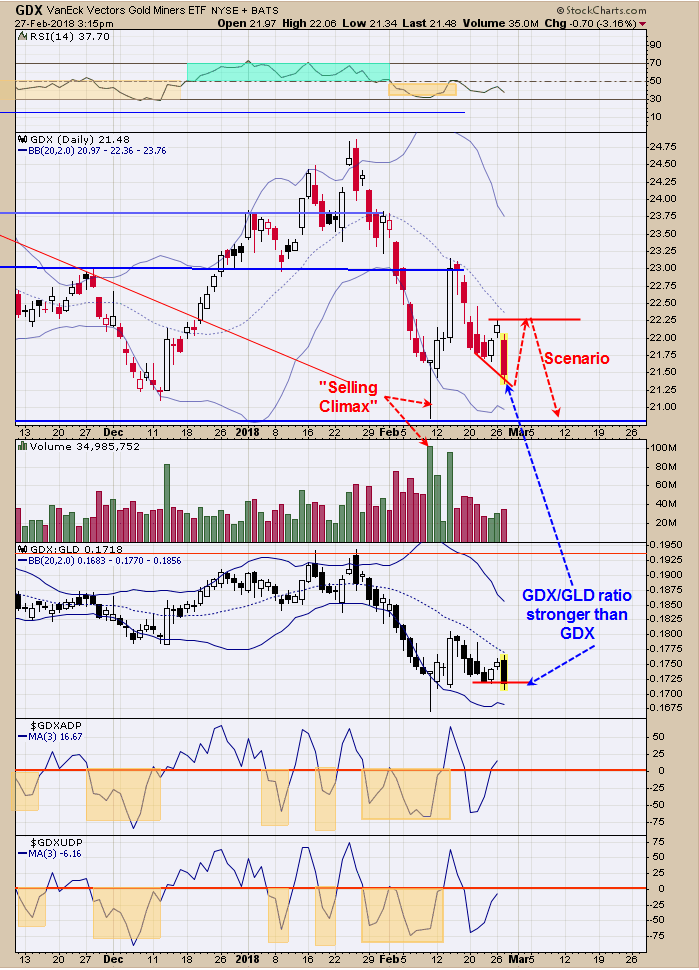
Today VanEck Vectors Gold Miners (NYSE:GDX) closed below its previous low and GDX/GLD ratio near matched its previous low, showing GDX/GLD ratio is stronger than GDX and a bullish sign for GDX. With GDX/GLD ratio showing relative strength compared to GDX, suggest GDX could bounce short term. A possible bounce target is yesterday’s high near 22.25 range. If this level is tested on lighter volume and GDX/GLD ratio shows weakness could lead to a bearish setup. A “Selling Climax” occurred on February 9 and at some point will be tested and a downside target. Neutral for now. New Book release "The Secret Science of Price and Volume" by Timothy Ord.


