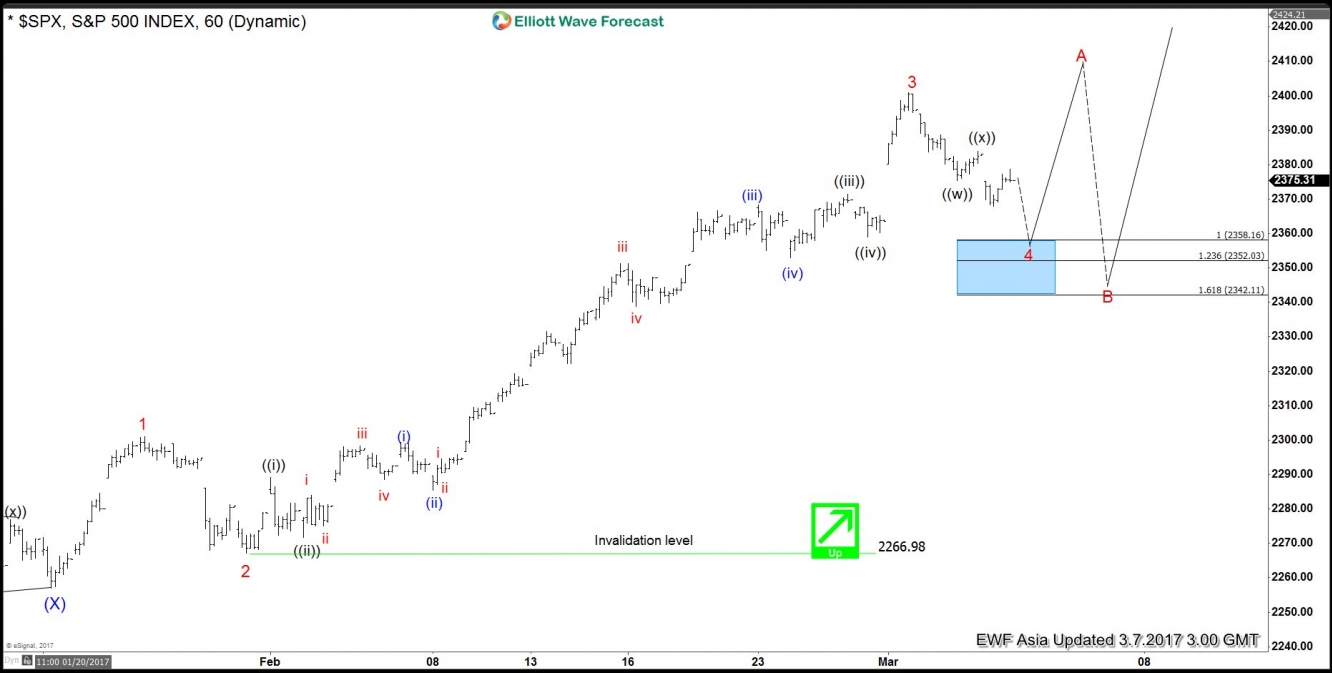
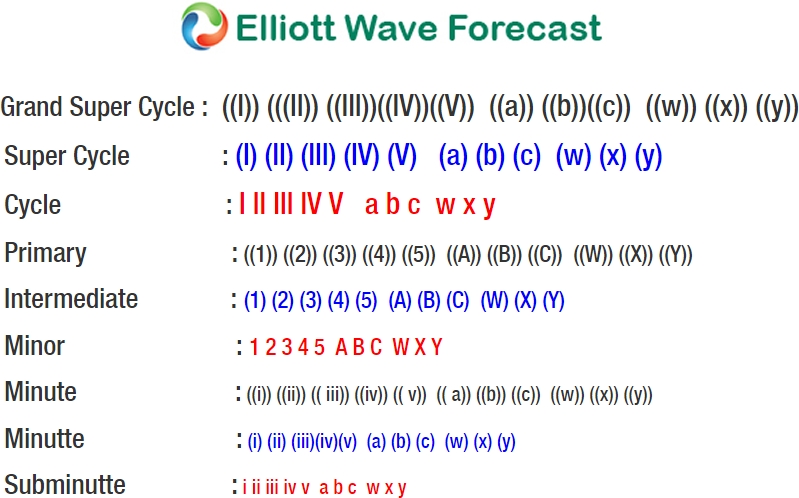
Short term Elliott wave view in S&P 500 suggests that the rally from 1/23 low is unfolding as a 5 waves Elliott wave impulse structure where Minor wave 1 ended at 2301, Minor wave 2 ended at 2267, and Minor wave 3 ended at 2400.98. Internals of Minor wave 3 shows an extension and subdivided also as an impulse structure where Minute wave ((i)) ended at 2289.1, Minute wave ((ii)) ended at 2271.6, Minute wave ((iii)) ended at 2371.54 and Minute wave ((iv)) ended at 2358.96. Minor wave 4 is unfolding as a double three where Minute wave ((w)) ended at 2375.4, Minute wave ((x)) ended at 2389.9, and Minute wave ((y)) of 4 is in progress towards 2352 – 2358 area before Index turns higher in Minor wave 5. We don’t like selling the Index and expect dips to find buyers in the area above for another push higher in Minor wave 5 or at least a 3 waves bounce.
S&P 500 1 hour chart

