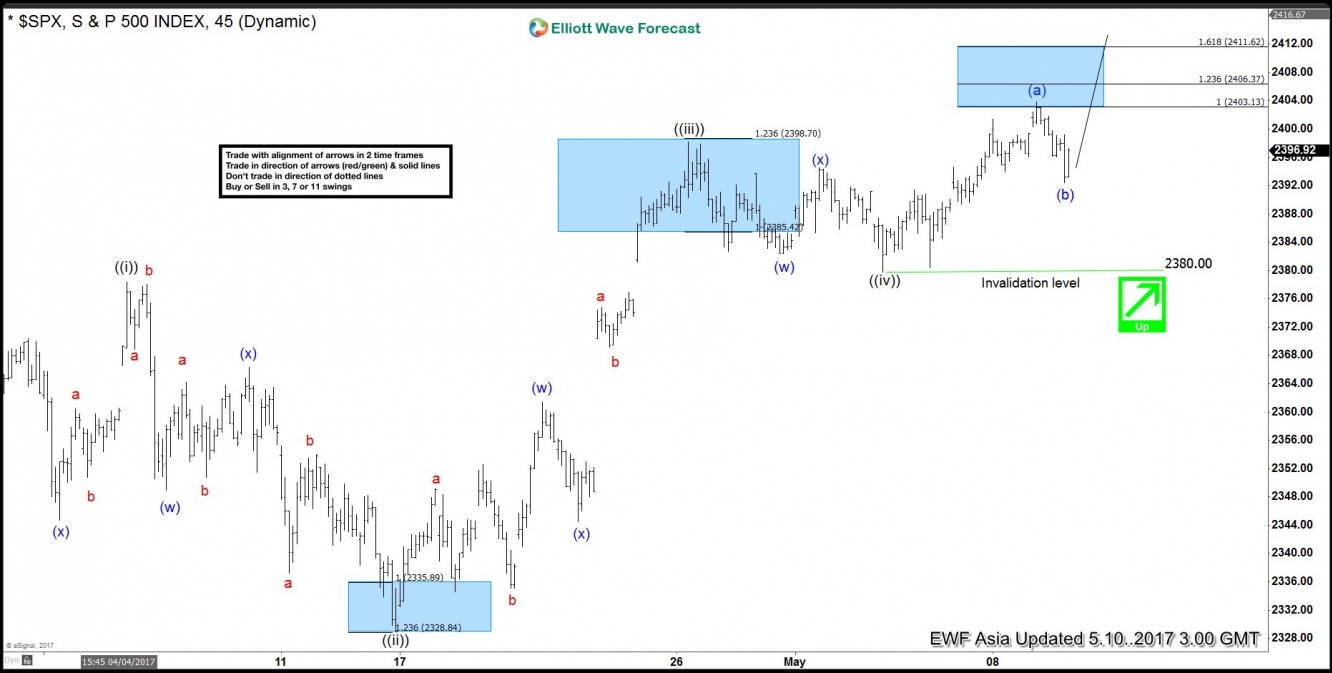
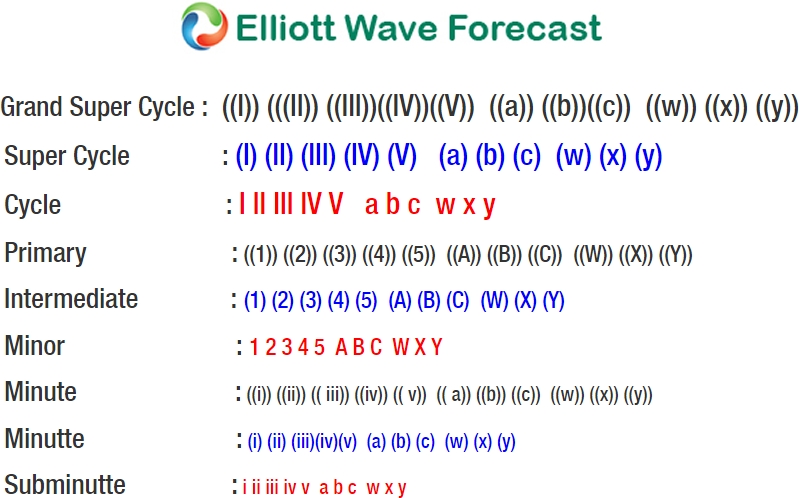
Short Term Elliott Wave view in F suggests the rally from 3/27 low (2322.2) is unfolding as a leading diagonal Elliott Wave structure where Minute wave ((i)) ended at 2378.36, Minute wave ((ii)) ended at 2328.95, Minute wave ((iii)) ended at 2398.16, and Minute wave ((iv)) ended at 2379.75. The Index has broken above previous Minute wave ((iii)) and thus it has met the minimum requirement in the number of swing to end cycle from 3/27 low as a leading diagonal. However, while near term pullbacks stay above 2380, further upside in one more leg still can’t be ruled out before cycle from 3/27 low ends. Near term, Minute wave (v) is proposed to be unfolding as a zigzag Elliott Wave structure where Minutte wave (a) ended at 2403.8 and Minutte wave (b) ended at 2392.4. While pullbacks stay above 2392.4, and more importantly above 2380, Index has scope to extend one more leg higher. We don’t like selling the Index.
S&P 500 1 Hour Elliott Wave Chart


