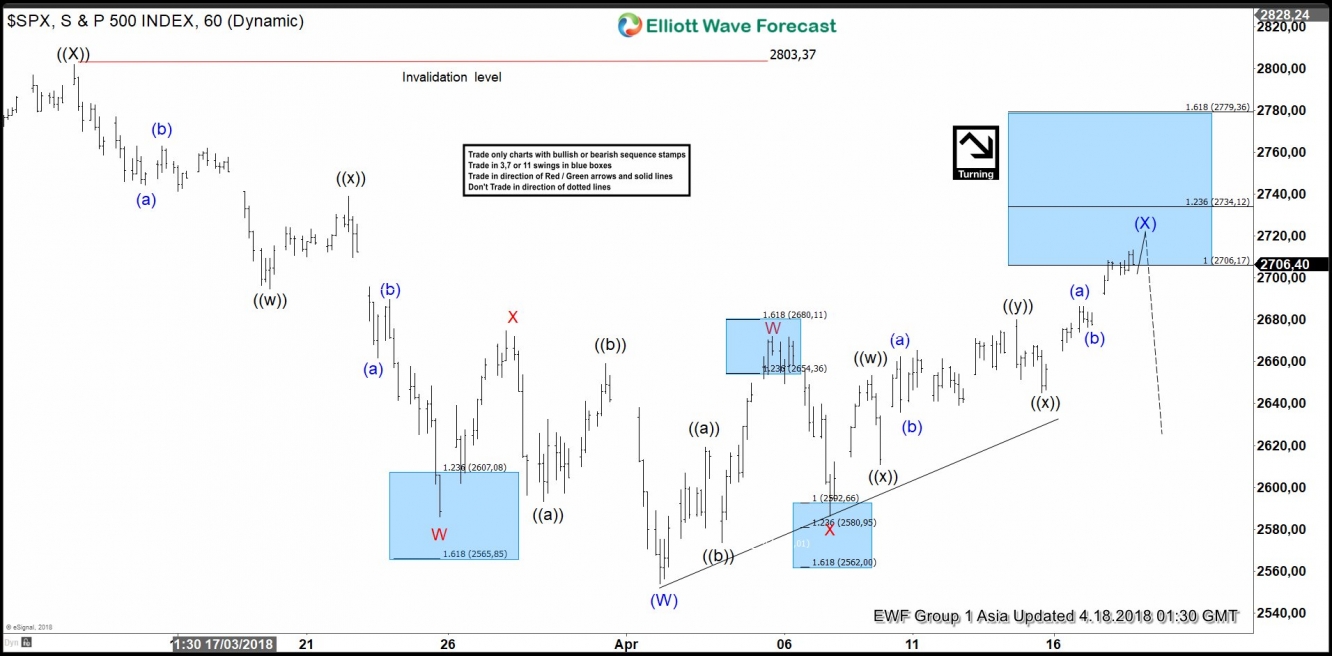
S&P 500 Elliott Wave view in short-term cycles suggest that the bounce to 3/13 high (2803.37) ended primary wave ((X)). Down from there, primary wave ((Y)) remains in progress as a double three Elliott Wave structure. The internal distribution of wave ((Y)) shows overlapping structure, thus favored it to be a corrective sequence i.e either W.X.Y or W.X.Y.X.Z.
Down from 3/13 high (2803.37), Intermediate wave (W) of ((Y)) ended at 2553.53 low as double three structure. Above from there, Intermediate wave (X) bounce remains in progress to correct cycle from 3/13 high. The internals of Intermediate wave (X) bounce is also unfolding as Elliott Wave Double Three structure where Minor wave W ended in 3 swings at 2672.08 and Minor wave X ended at 2586.27. Above from there, Minor wave Y remains in progress as Triple three structure, which has already reached the 100%-123.6% Fibonacci extension area of W-X at 2706.17-2734.12. The internals of wave Y ended Minute wave ((w)) at 2653.55, Minute wave ((x)) at 2610.79, Minute wave ((y)) ended at 2680.26, and Minute second wave ((x)) ended at 2645.05 low. Near term, as far as a pivot from 3/13 high (2803.37) remains intact, expect Index to resume lower in intermediate wave (Y) or pullback in 3 swings at least. We don’t like selling it.
S&P 500 Elliott Wave 1 Hour Chart


