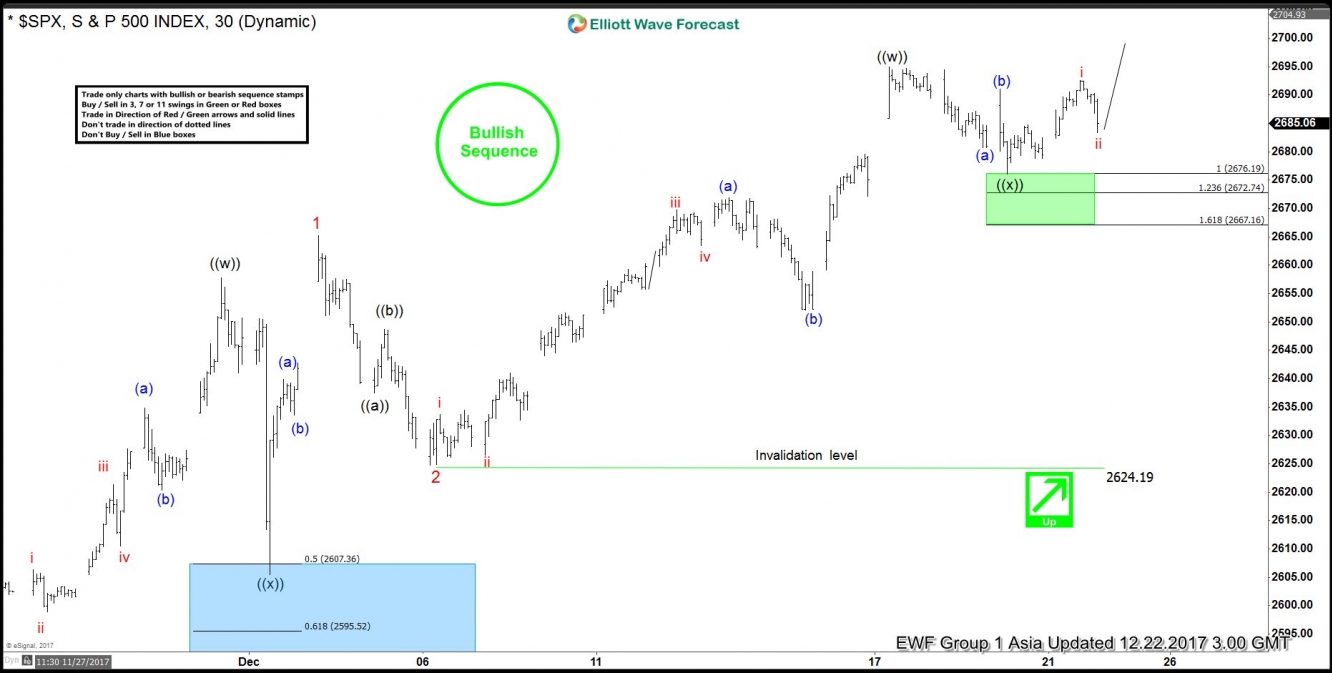
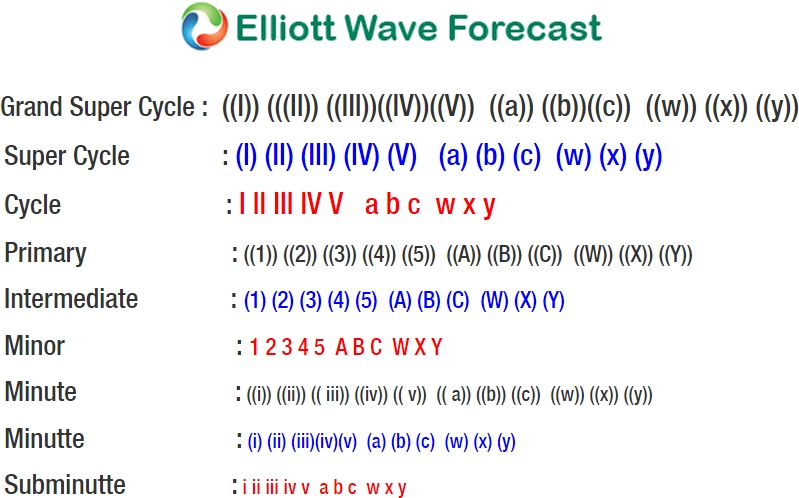
SPX Short term Elliott Wave view suggests that the rally to 2664.58 ended Minor wave 1 as a Leading diagonal. Below from there Minor wave 2 ended as a zigzag correction at 2624.19 low, above from there Minor wave 3 remains in progress as a double structure. And showing the incomplete bullish sequence to the upside. The Minutte wave (a) of ((w)) ended in 5 waves at 2671.92 high. Where internals of that leg Subminutte wave i ended at 2633.72, Subminutte wave ii ended at 2626.32 low, Subminutte wave iii ended at 2669.68. Subminutte wave iv ended at 2663.68 and Subminutte wave v of (a) ended at 2671.92. Below from there, it ended the Minutte wave (b) 2651.78 low, above from there Minutte wave (c) of ((w)) ended in another 5 waves at 2695.38 peak and also ended the cycle from 12/06 low 2624.19 there.
Currently, the index could have finished correcting the cycle from 12/06 low in 3 waves at 2675.72 low in Minute wave ((x)) pullback, where Minutte wave (a) ended at 2680.28, Minutte wave (b) ended at 2691.38. After reaching the Green box (potential buying area) 2676.19-2667.16 100%-161.8% Fibonacci extension area. While above 2675.72 low and more importantly the pivot from 12/06 low 2624.19 stays intact index is expected to resume the upside in Minute ((y)) leg higher within wave 3. However, the index still needs to see a break above 2695.38 peak to avoid the double correction lower towards 2673.02-2660.92 in Minute wave ((x)) pullback. Don’t like selling it and like staying long from 2676.19 previous equal legs area with the risk-free position. But if it does the double correction lower, we would like to be buyer’s again at the 2673.02-2660.92 area provided the pivot at 2624.19 low remains intact.
SPX 1 Hour Elliott Wave Chart


