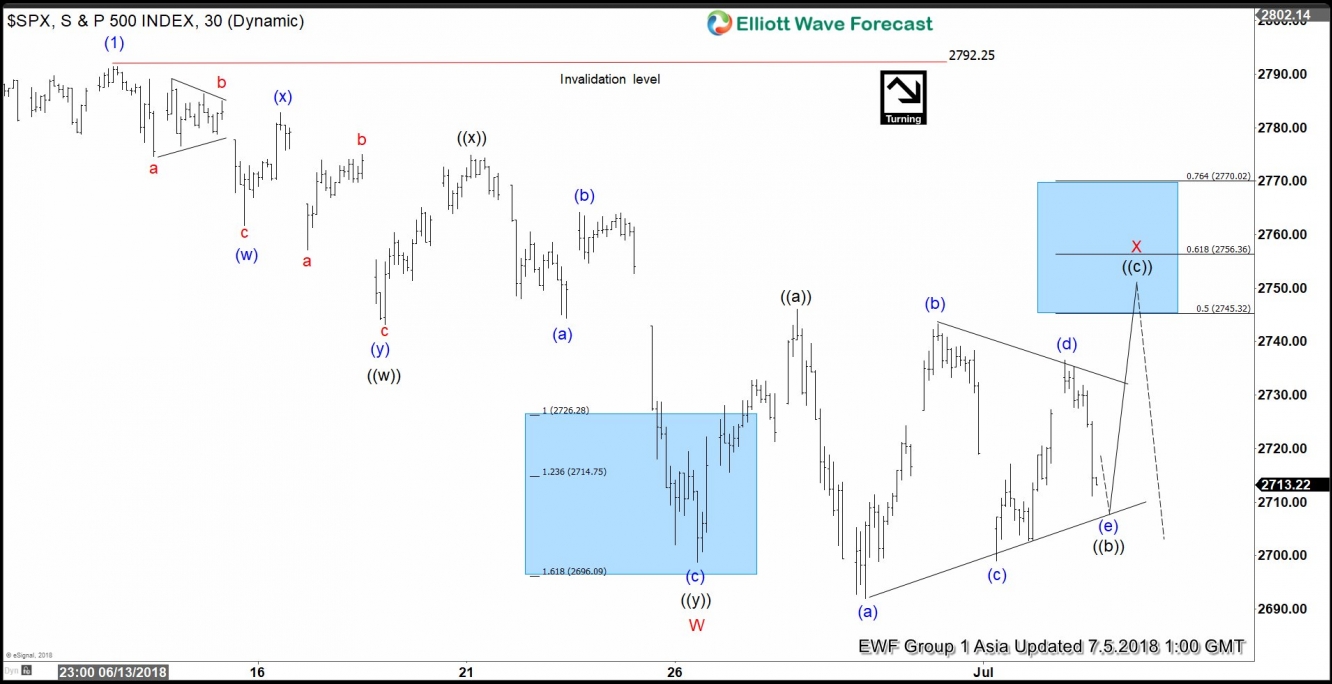
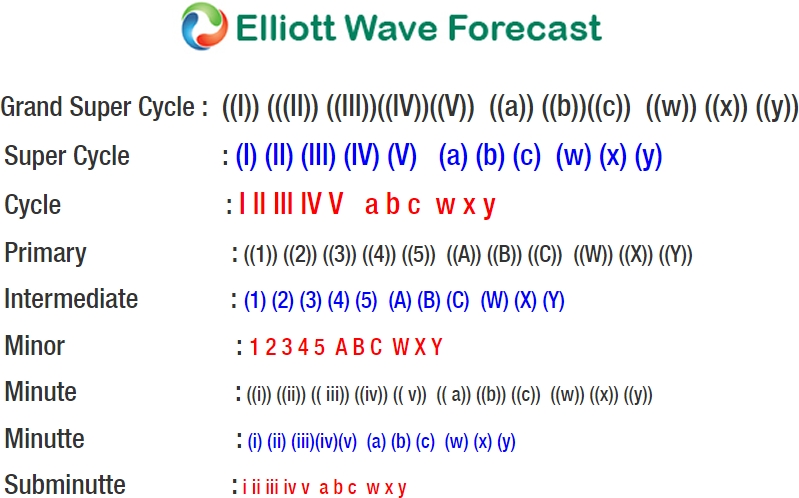
S&P 500 short-term Elliott wave analysis suggests that the rally from 4/02/2018 low to $2792.25 ended the intermediate wave (1). Down from there, correction against that cycle remains in progress in 3, 7 or 11 swing structure. Also, it’s important to note here that the decline from $2792.25 peak shows an overlapping price action thus suggesting that the correction is taking place in a corrective manner i.e either Double three or Triple three structure.
Down from $2792.25, Minor wave W unfolded as a double three structure with a combination of 3,3,3 swings in each leg. Minute wave ((w)) of W ended at $2743.10, Minute wave ((x)) of W ended at $2774.86 and Minute wave ((y)) of W ended at $2698.67 low. Up from there, Minor wave X bounce remains in progress to correct cycle from 6/13 high ($2792.25) as a Zigzag structure where Minute wave ((a)) ended at $2746.09 and Minute wave ((b)) remains in progress as a running triangle structure. Near-term focus remains towards $2745.32-$2756.36, which is the 50%-61.8% Fibonacci retracement area of the cycle coming from $2792.25 high to complete Minute wave ((c)) of X. Afterwards, the index is expected to continue lower in Minor wave Y to correct cycle from 4/02/2018 low. We don’t like selling the proposed pullback.
S&P 500 1 Hour Elliott Wave Chart


