💎 Fed’s first rate cut since 2020 set to trigger market. Find undervalued gems with Fair ValueSee Undervalued Stocks

SPX Intermediate Cycle Momentum Could Be Stalling

Published 11/19/2017, 02:05 AM
Updated 07/09/2023, 06:31 AM
US500
-

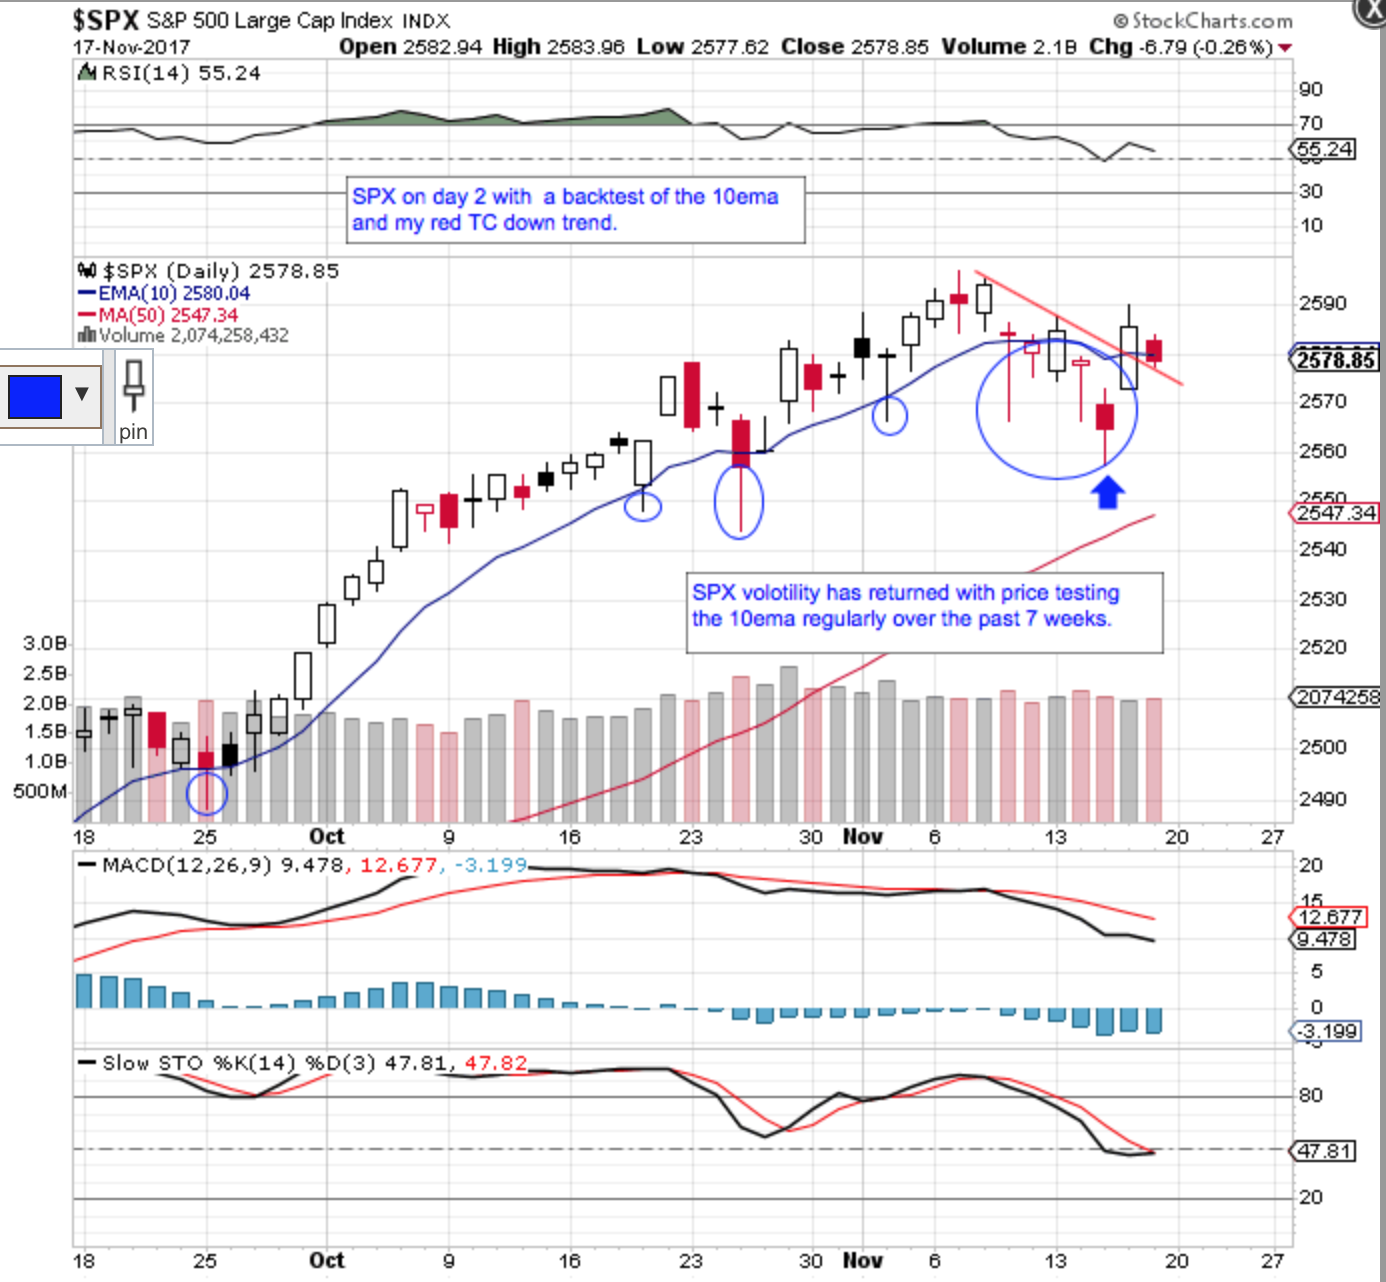
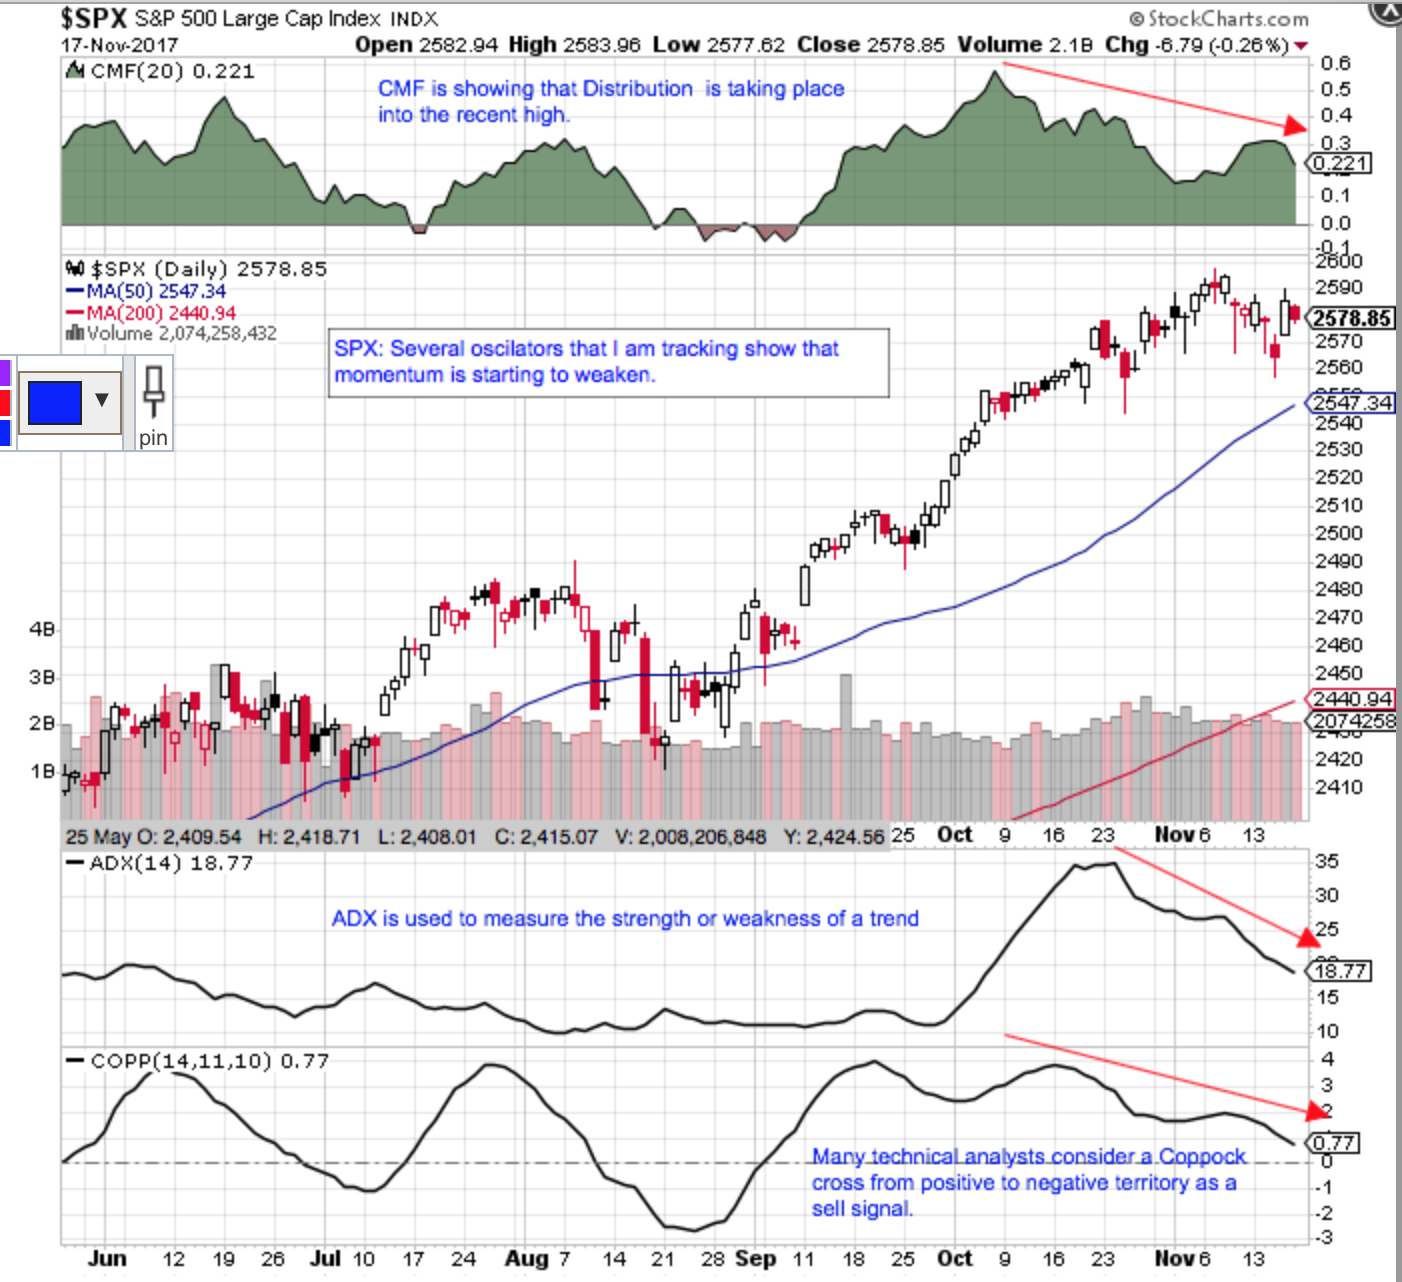
I have the S&P 500 on just day two of a new short term Trading Cycle but many of the technical indicators I watch are showing signs that the momentum of the SPX’s longer 5-6 month Intermediate Cycle (IC) are starting to stall near the 3 month mark of the current IC Uptrend. My first Daily chart shows volatility has returned and we often see this at cycle turns. Yes we are on day 2 out of a TCL/DCL but my second chart also shows 3 key TA indicators that may be signaling a top forming on the SPX’s longer Intermediate Cycle.

One of our subs pointed out that there was an extremely large WSJ Selling on Strength on the SPX on Thursday’s surge out of the TCL (over 700 million in large block trades). My expectations are still that stocks will likely retest the recent highs at the very least in the next week or so but I plan to keep a tight leash on my positions based on my 4 charts below.

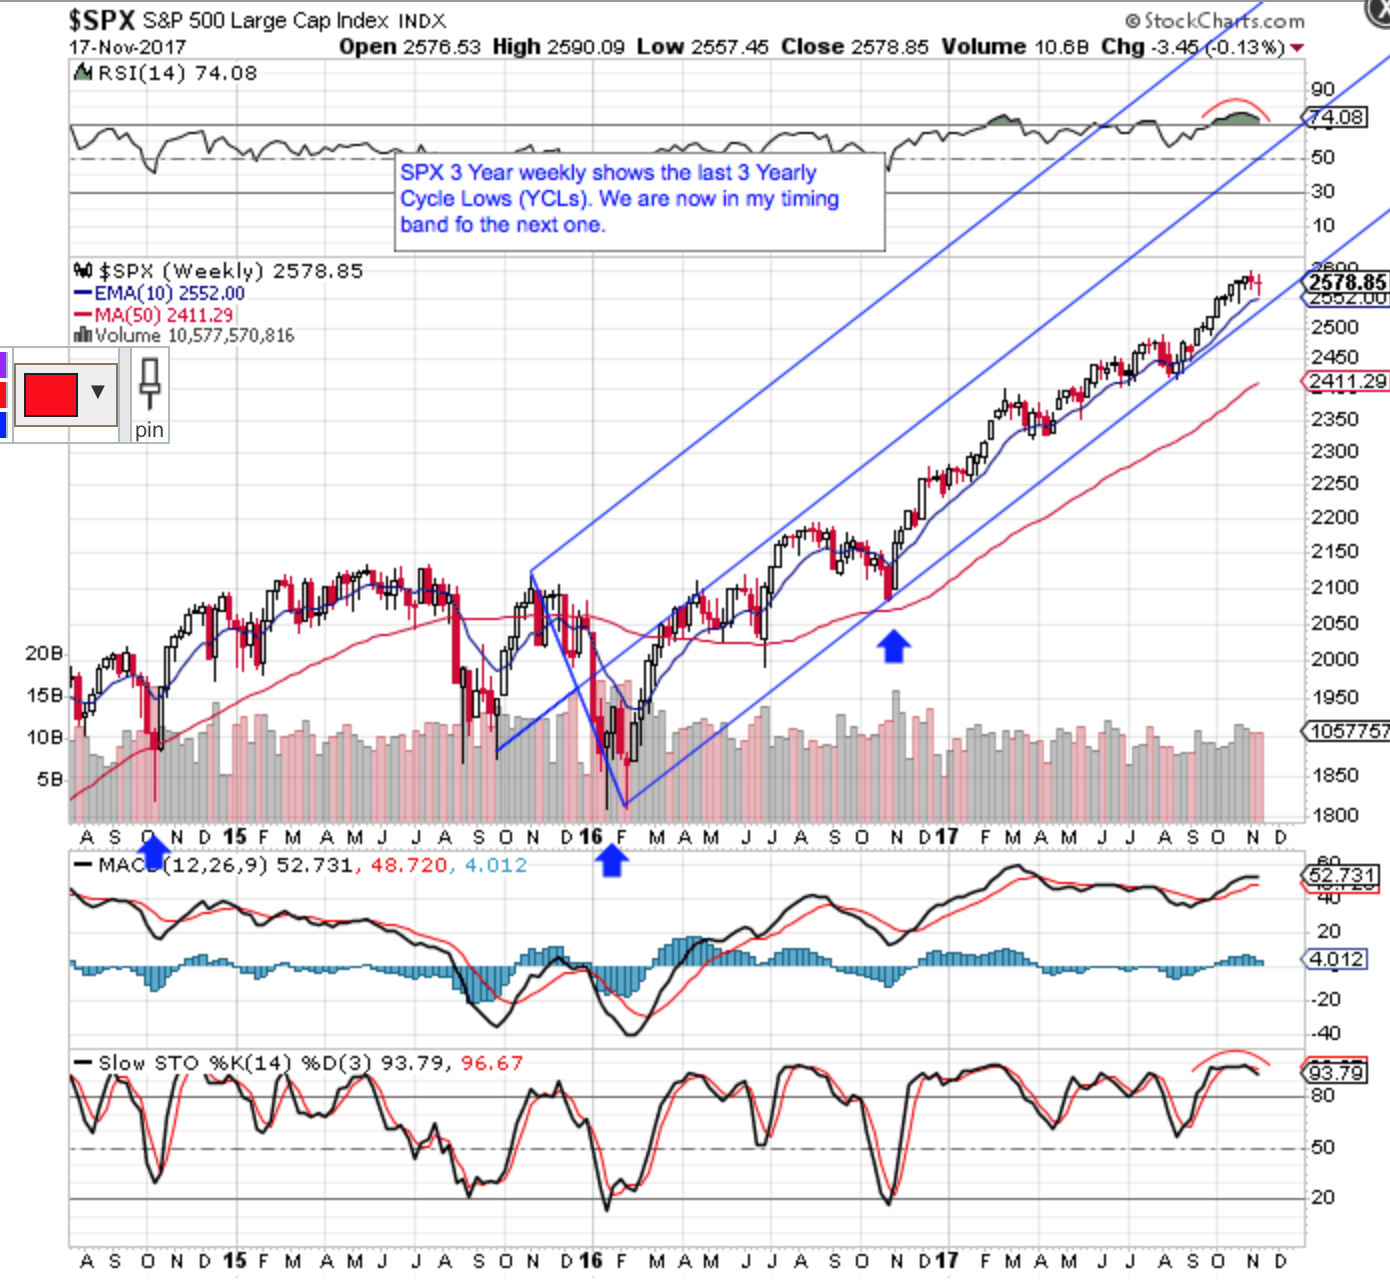
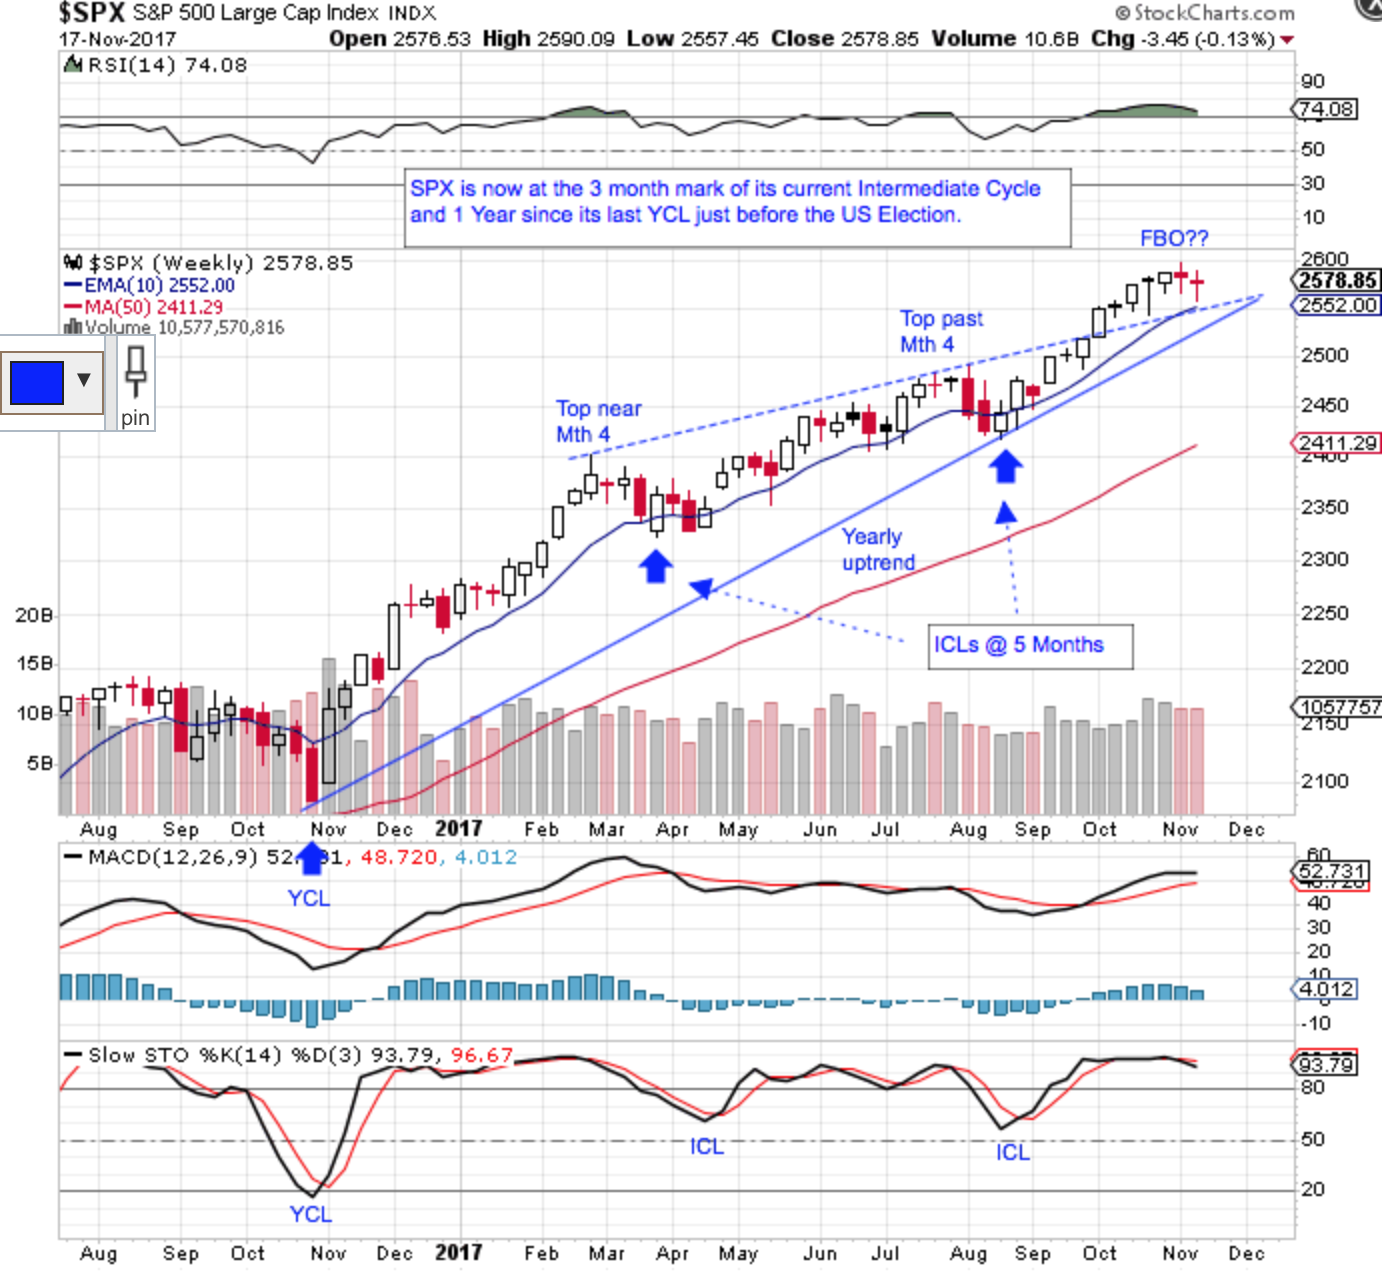
While I do not believe this is the top of this Bull market just yet, stocks likely need a normal Intermediate Cycle Low (ICL) to reset investor sentiment to bearish for the next leg up in 2018. My 3rd chart is a 3 Year weekly showing you that the SPX is in my timing band to find its next Yearly Cycle Low (YCL). Lastly, my 4th chart shows that the last two ICLs were very mild and did not even have a failed short term Trading Cycle (TCL). My expectations are that this will change back to the Cycle Nom if we are to find the next YCL near the 5-6 month mark. If I am correct, the lower blue uptrend lines in my last two charts should break down during the move into the YCL.
SPX Daily ChartSPX Daily ChartSPX Weekly Chart SPX Weekly Chart

Latest comments

Loading next article…
Risk Disclosure: Trading in financial instruments and/or cryptocurrencies involves high risks including the risk of losing some, or all, of your investment amount, and may not be suitable for all investors. Prices of cryptocurrencies are extremely volatile and may be affected by external factors such as financial, regulatory or political events. Trading on margin increases the financial risks.
Before deciding to trade in financial instrument or cryptocurrencies you should be fully informed of the risks and costs associated with trading the financial markets, carefully consider your investment objectives, level of experience, and risk appetite, and seek professional advice where needed.
Fusion Media would like to remind you that the data contained in this website is not necessarily real-time nor accurate. The data and prices on the website are not necessarily provided by any market or exchange, but may be provided by market makers, and so prices may not be accurate and may differ from the actual price at any given market, meaning prices are indicative and not appropriate for trading purposes. Fusion Media and any provider of the data contained in this website will not accept liability for any loss or damage as a result of your trading, or your reliance on the information contained within this website.
It is prohibited to use, store, reproduce, display, modify, transmit or distribute the data contained in this website without the explicit prior written permission of Fusion Media and/or the data provider. All intellectual property rights are reserved by the providers and/or the exchange providing the data contained in this website.
Fusion Media may be compensated by the advertisers that appear on the website, based on your interaction with the advertisements or advertisers.
© 2007-2024 - Fusion Media Limited. All Rights Reserved.