- Monitoring purposes S&P 500; Flat.
- Monitoring purposes Gold: Short (ARCA:GDX) on 4/7/15 at 19.22; stop 20.26.
- Long-Term Trend monitor purposes: Flat

Timers Digest ranked the Ord Oracle (NYSE:ORCL) #6 in performance for 3 months updated March 9, 2015.
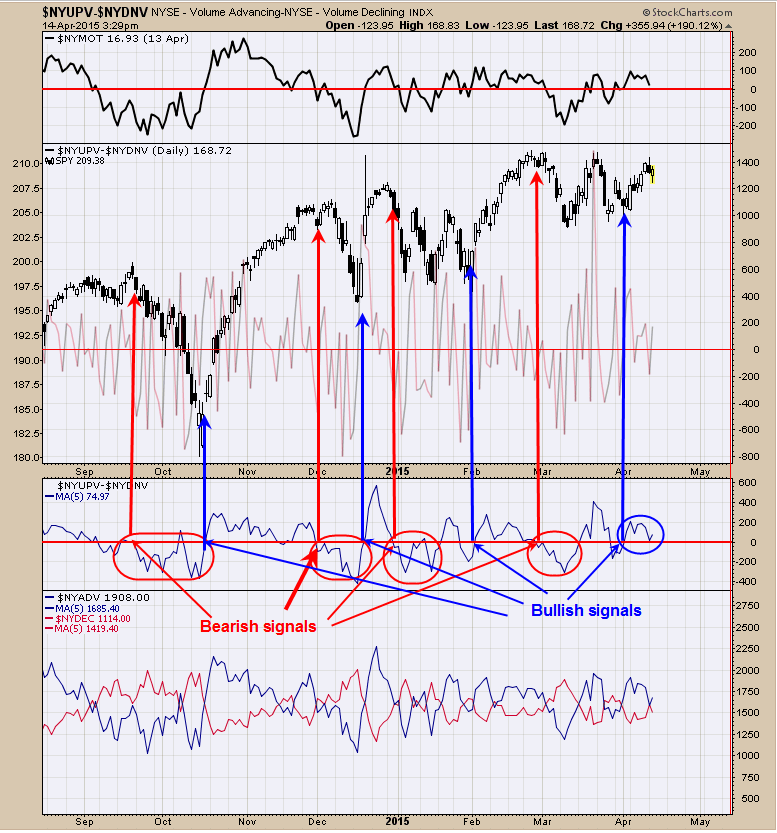
The window below the (ARCA:SPY) window is the NYSE up volume minus NYSE down volume with a 5 period moving average. Rallies in the market are accompanied with more up volume compared to down volume and declining markets are accompanied with more down volume compared to up volume and this indicator shows that relationship graphically. When the up down volume 5 period moving average falls below the “0” line than down volume is ahead of up volume and a bearish sign for the market and that relationship is identified with a red arrow. AS long as the down volume is ahead of the up volume and below the “0” line, than the trend in the market is down. When the 5 period moving average of the up volume is above the “0” line than up volume is out pacing down volume and a bullish sign for the market, which is identified with blue arrows. Since the low back in early April the up volume is still in control but has made lower highs and appears weakening.

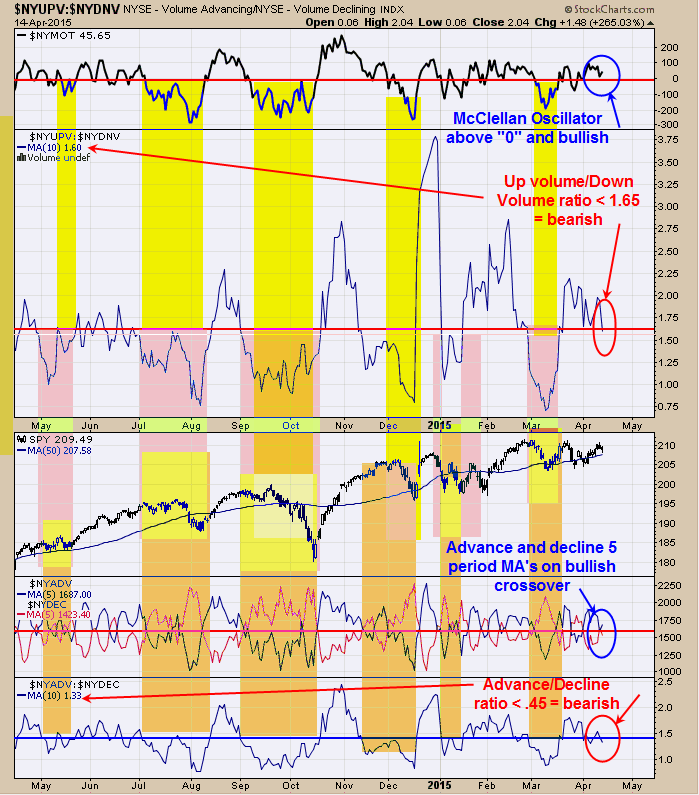
The above chart helps us in the direction of the trend for the market. The top window is the NYSE McClellan Oscillator and readings above “0” are considered bullish and today’s trend closed at +45.65. Next window down is the NYSE up volume/NYSE down volume with 10 period Moving average. Readings above 1.65 on this ratio is considered bullish for the market and today’s reading closed at 1.60. The bottom window is the NYSE Advance/NYSE Decline with 10 period moving average. Readings above 1.45 on this ratio is a bullish sign for the market and today’s close was 1.33. Next window up is the NYSE advancing with 5 period MA and NYSE declining with 5 period MA. These two moving average are holding on to a bullish crossover but barely. To sum up; for the four indicators above, two are bullish and two are bearish. We are expecting an eventual bullish outcome. The short-term picture is unclear for the moment.

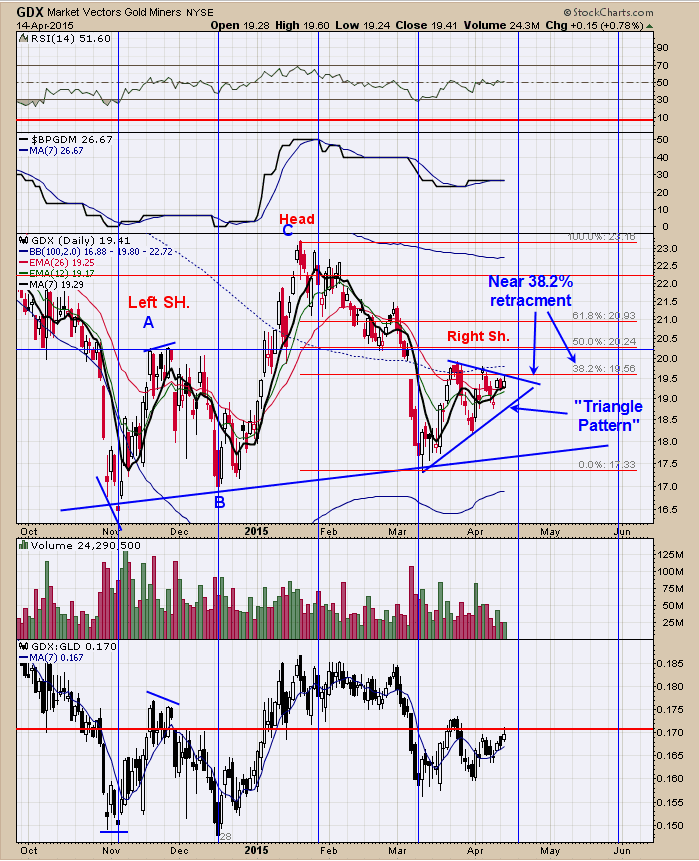
The pattern that may be forming on GDX is a Head and Shoulders top where the January high is the Head and the Right shoulder is forming now. The “Right Shoulder” also appears to be drawing a “Triangle pattern”. Normally a “Triangle pattern” breaks in the direction the preceded the pattern, and in this case it would be down. Also notice that since the early March low, GDX has only managed to retrace about 38.2% of the move down from the January high, which shows a weak market. The “line in the sand” is the 20.21 level. If GDX manages to break above that level with a “Sign of Strength” it would turn the trend back to bullish. Since GDX remains below that level the picture remains bearish. The monthly charts however are showing bullish divergences and the next major cycle low is due in July or August, Short GDX at 19.22 on 4/7/15; stop at 20.26.
For examples in how "Ord-Volume" works, visit www.ord-oracle.com. New Book release "The Secret Science of Price and Volume" by Timothy Ord, buy on www.Amazon.com (NASDAQ:AMZN).
Signals are provided as general information only and are not investment recommendations. You are responsible for your own investment decisions. Past performance does not guarantee future performance. Opinions are based on historical research and data believed reliable, there is no guarantee results will be profitable. Not responsible for errors or omissions. I may invest in the vehicles mentioned above. Copyright 1996-2014. To unsubscribe email to tim@ord-oracle.com.
