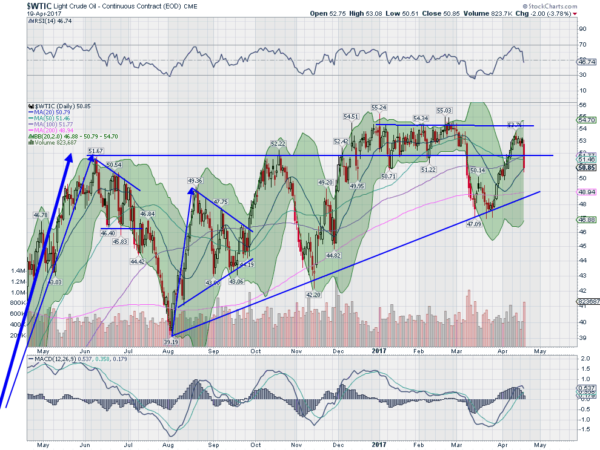
What a difference two weeks makes. Two weeks ago crude oil was roaring higher. It had just reached a critical resistance level and I wrote here about the potential for more upside. At the very least it was time to watch it. It did move higher through the resistance but sputtered again in the prior consolidation region. That was until Wednesday. What a move lower!
The chart shows how crude oil gave up the prior resistance level with ease as it plummeted through in one day. No sign of support this time. It ended the day at the 20 day SMA. This did some damage to the chart. It has now made a lower high for one thing. It also has momentum swinging to the downside. The RSI is still in the bullish range but falling fast. The MACD is about to cross down, giving its own sell signal. And what about the price? As I write in the pre-market hours it has turned back lower to Wednesday’s low after a small overnight bounce.

So what is next for this liquid gold? Thursday could tell the story short term. A continuation lower would suggest a move to the 200 day SMA at about $49 at least. Below that there is support at $48 and $46 with the potential to test the highly traded $44 area. Longer term a move to the low $40’s would suggest a retest at $30 for a possible long term double bottom. But a bounce Thursday could reverse that view. A move back over 51.50 would be very constructive for oil bulls. Time to focus with an eagle’s eye here.
DISCLAIMER: The information in this blog post represents my own opinions and does not contain a recommendation for any particular security or investment. I or my affiliates may hold positions or other interests in securities mentioned in the Blog, please see my Disclaimer page for my full disclaimer.
