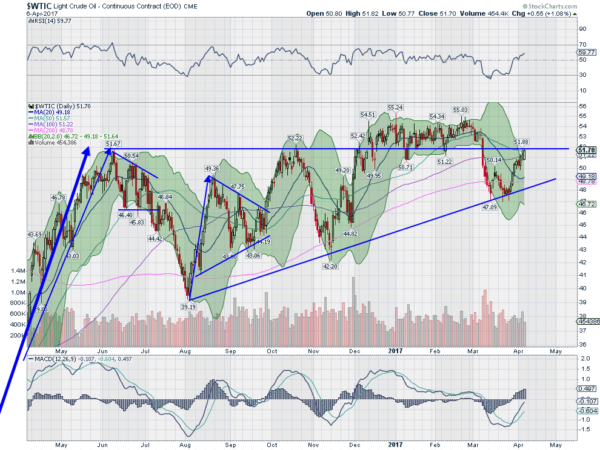
Trump got elected and all assets moved higher, including crude oil, which continued higher until it met resistance that had turned it back in October and May before that. But this time it broke through to new highs. Traders typically see that and look for continuation. But that did not happen. Instead crude ran sideways for 3 months.
In March, crude oil finally broke down, giving up the meager breakout and dove lower. The chart below shows some interesting things since that fall began. The pullback brought crude to the rising trend support line that appeared with the November reversal and held. A third higher low was formed. A small bounce from there and a pullback to the low again held a second time. With the reversal over the mid March bounce, a double bottom was confirmed — and it has continued higher.

At week's, oil is now back at that prior resistance level following a strong move on Thursday. The rest of the chart supports a second attempt at a breakout to the upside. The Bollinger Bands® are opening up. The RSI is rising back into the bullish zone. The MACD has been rising and is about to turn positive. Will it breakout and continue this time? It's time to pay attention.
