This article is for the speculator who's not averse to taking a reasonable risk in hopes of generating an above-average return in a relatively short period of time.
Caveat
Two things to note:
*Nothing that follows should be considered a “recommendation”. I am simply attempting to present some potential opportunities that I see setting up in a variety of markets.
*All of the examples and charts come from the futures markets. Where applicable though, I also list the ticker symbol for the ETF that tracks the market in question. These ETFs allow a trader to buy or sell short a given commodity just as they would buy or sell short shares of any stock – without having to trade futures contracts.
British Pound
I wrote about this last week, but as you can see in Figure 1, the Pound appears to be setting up for a move to the upside. The stop-loss point would be below the lowest-low, drawn in Figure 1.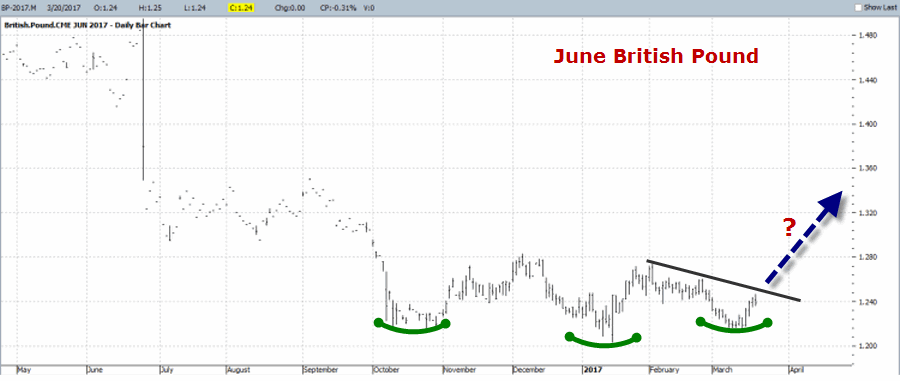
Figure 1 (Courtesy ProfitSource by HUBB)
The British Pound ETF is Guggenheim CurrencyShares British Pound Sterling (NYSE:FXB).
Euro
As you can see in Figure 2, the Elliott Wave count from ProfitSource by HUBB is projecting a move to lower levels for the euro. The single currency is slightly overbought and there is an identifiable “Uncle” point at the black horizontal line.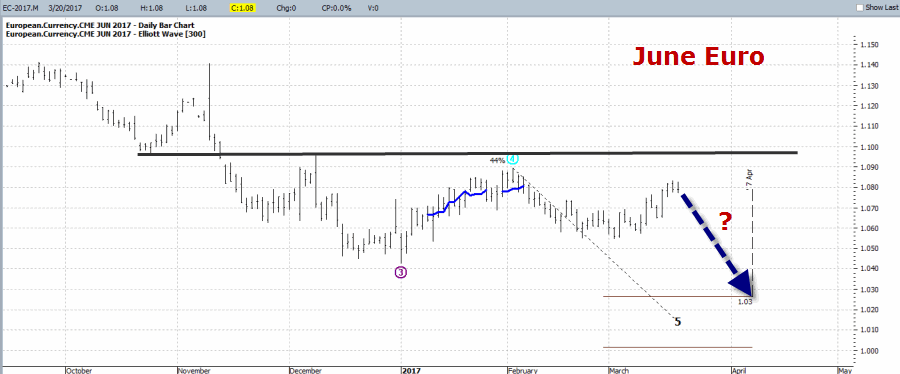
Figure 2 (Courtesy ProfitSource by HUBB)
The euro ETF is Guggenheim CurrencyShares Euro (NYSE:FXE).
Gold
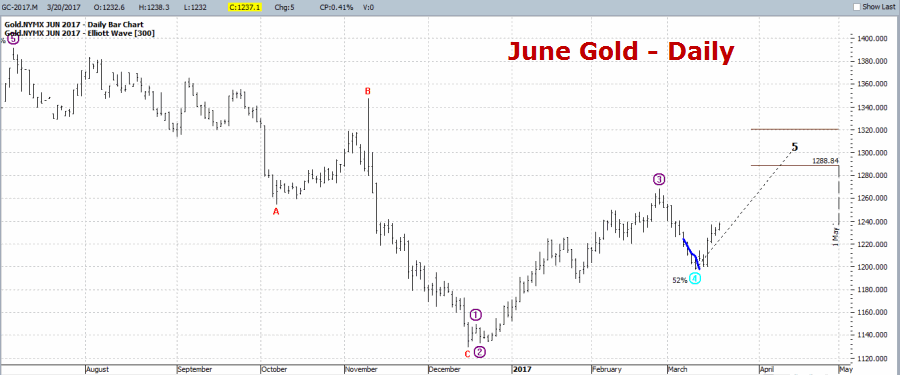
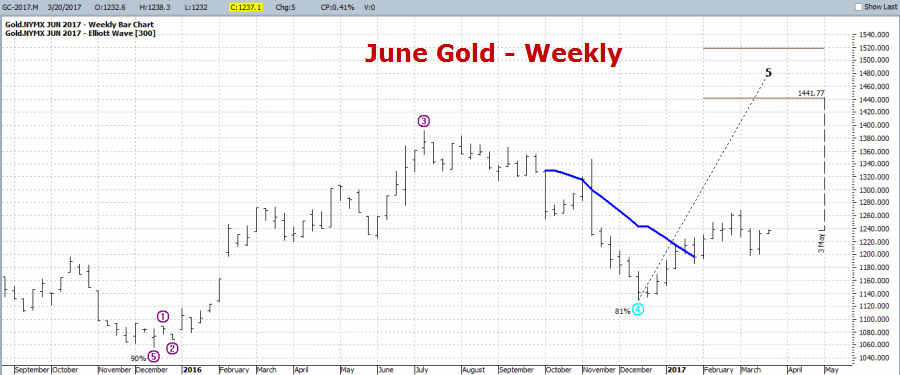
Gold has been wildly unpredictable of late, so any position here -- long or short -- is definitely speculative in nature. That said, as you can see in Figures 3 and 4, the daily and weekly Elliott Wave counts for June Gold futures are both projecting higher. Does this mean that gold is sure to rise? Not at all. It does tell me to look to play the long side for now. A reasonable stop-loss would be below the March low on the daily chart.
Figure 3 (Courtesy ProfitSource by HUBB)
Figure 4 (Courtesy ProfitSource by HUBB)
The gold ETF is SPDR Gold Shares (NYSE:GLD) (or iShares Gold (NYSE:IAU)).
Soybeans
Soybeans DO NOT always rally in late winter to early spring. But if beans are going to make a move higher, this is the time we should be looking for it. A potential stop-loss level would be somewhere below the support area drawn in Figure 6.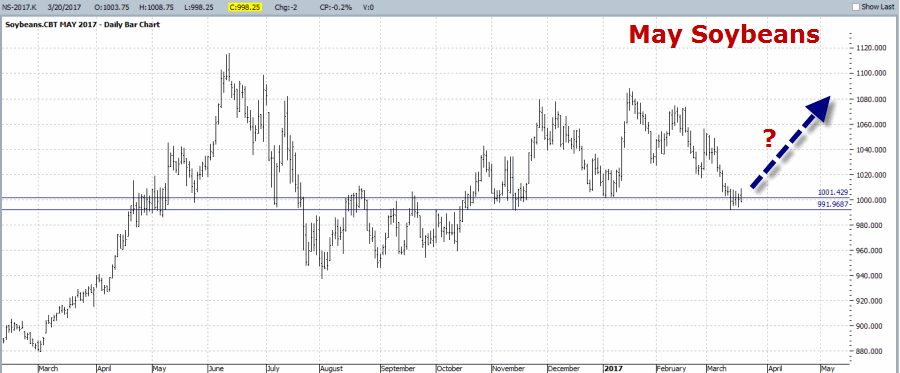
Figure 5 (Courtesy ProfitSource by HUBB)
The soybean ETF is Teucrium Soybean (NYSE:SOYB).
Sugar
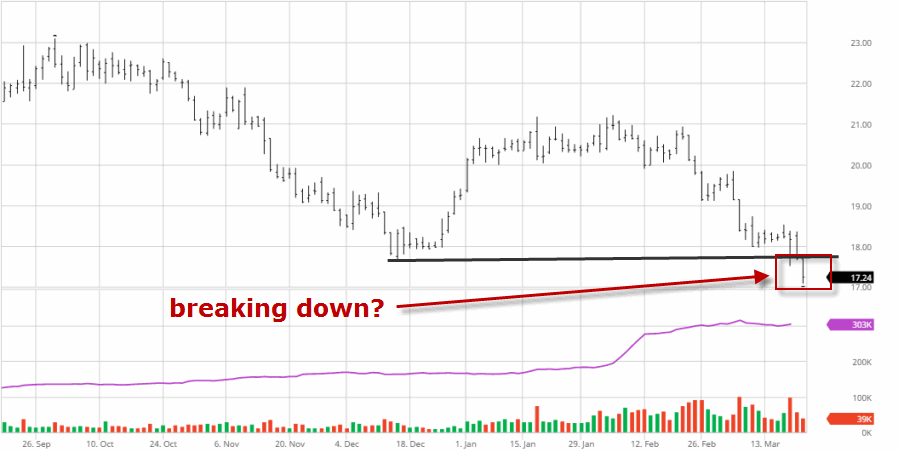
As I noted several weeks ago, sugar has a tendency to display weakness during the March/April period. In Figure 6 we see that May Sugar may be breaking to the downside (although, if sugar bounces back quickly above the black line in Figure 6, then all bets are off.
Figure 6 (Courtesy ProfitSource by HUBB)
The Sugar ETF is iPath Bloomberg Sugar Subindex Total Return Exp 24 June 2038 (NYSE:SGG)
Summary
Are any of these good ideas that will actually pan out? As always, only time will tell. What they do represent though are potential opportunities.
Whether or not to act on any of these opportunities, and how to go about it (long or short futures contracts, long or short ETF shares, options on futures, options on ETFs, etc) are all decisions that each trader must make on their own.

