Scores of extremely bullish investors insist that the financial markets today do not resemble the technology stock craze near the tail end of the late 1990s. That position is getting more difficult to defend.
For example, market capitalization to GDP is a long-term stock valuation indicator with a high correlation (0.89) to subsequent 10-year returns. The valuation tool is frequently referred to as the “Warren Buffett Indicator.” The reason? In 2001, the Oracle) of Omaha dubbed it as “…the best single measure of where valuations stand at any given moment.”
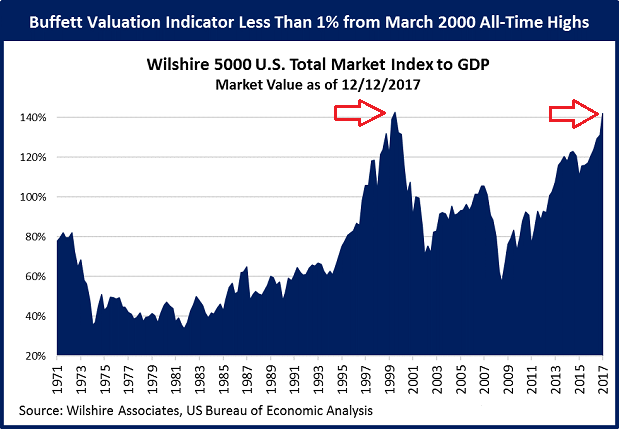
My eyesight may be faltering in my 51st year of life. Nevertheless, I am fairly certain that the breach of 140% by the Buffett Indicator in December of 2017 is very similar to the one that occurred in March of 2000.
There was a feeling then, as there is right now, that one had to invest his/her cash somewhere. Then, cash equivalents might only have been rewarding savers with 5%. (What people would not give for a risk-free 5% right now.) Yet that was deemed idiotic when stocks delivered 18%-20% in the “New Economy.”
In 2017, cash equivalents might provide 1.5%. “An unacceptable return,” many allege. “That just loses to inflation.” Stocks deliver 8%-10% over time, so why would you consider anything else?
It follows that many have been throwing in the cash towel. The stock-to-cash ratio at 5.0 in 2017 is extremely similar to the ratio during late ’90s insanity.
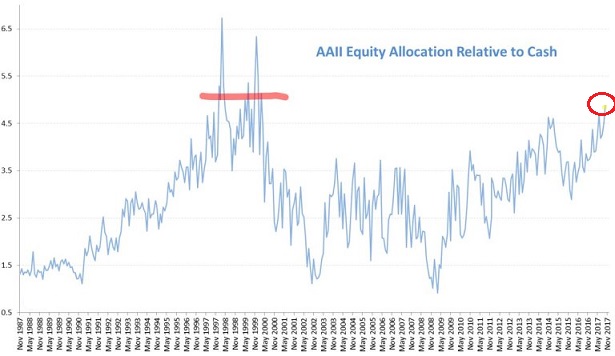
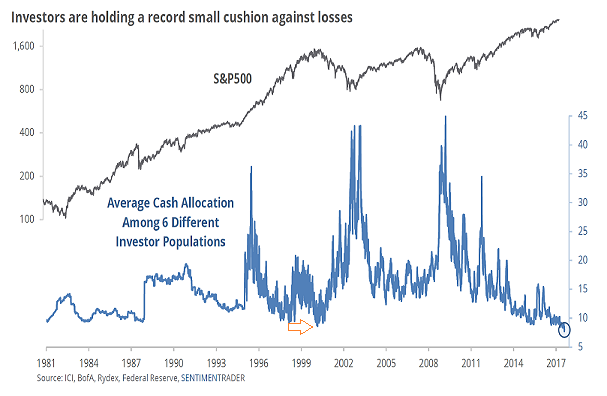
In the same vein, the average allocation to cash by investors in 2017 is actually slightly lower today than it was in 2000. Granted, the data does not imply that stocks must collapse from this moment forward. Yet it would be foolish to ignore circumstances that are undeniably analogous.
Let’s take the resemblance between the two periods one step further. Special purpose acquisition companies (a.k.a. “SPACs”) hit a global issuance record this year. What are SPACs? These are publicly-listed corporations that raise money from investors for an undefined business.
In other words, companies with no profits or specific prospects have raised $14 billion in blank check funding. These newly listed shares simply accumulate gobs of dollars from the speculative and the hopeful, all in a blind faith attempt for the money to earn more than cash equivalents.
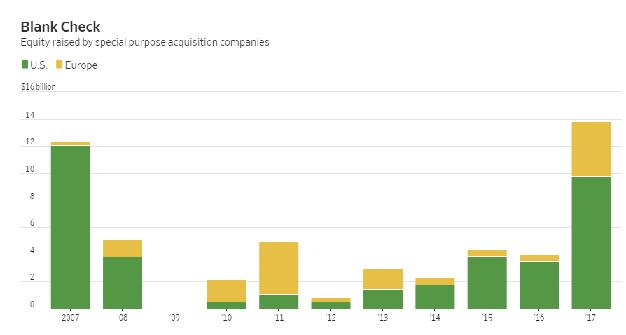
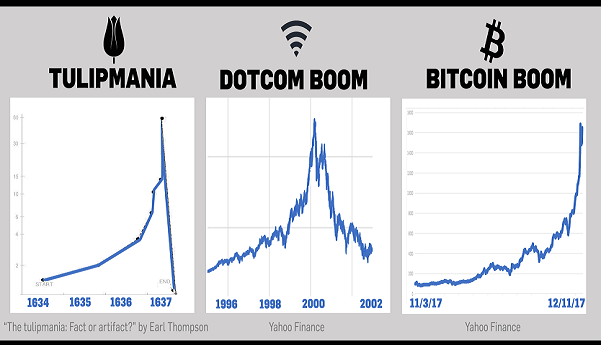
Blank check funding? Does that not evoke a whiff of the previous century’s New Economy elation? Meanwhile, bitcoin fanaticism in 2017 certainly sparks memories of 1999’s dotcom delirium.
There is some irony in the fact that a number of measures are still below the “2000 peak.” For instance, household equity as a percentage of total financial assets has reached its second highest level ever (36.3%). Yet the absolute peak hit 42% at the 2000 pinnacle.
Far too many folks conclude that there is a ton of room for stocks to power higher because we have not reached the 2000 bubble’s level. Seriously? The second-highest stock investment level on historical record – second only to 2000’s monstrously precarious balloon – and that supports an aggressively bullish stance?
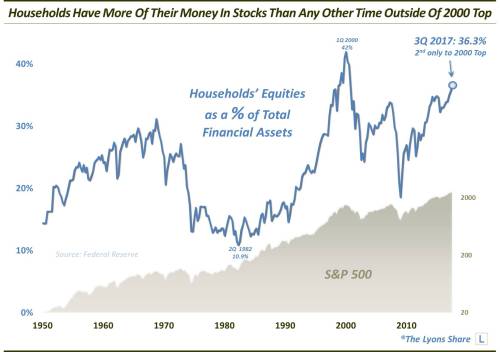
Keep in mind, household equity allocations at these levels average 10-year subsequent returns in the neighborhood of 3.7% annualized. And that’s probably going to come with a pretty nasty bearish interlude or two in between. Buying-n-holding through those storms will undoubtedly test the psychological wherewithal of market participants.
In truth, there are positives to advance the euphoric stock buying spree. The global economy has been showing signs of improvement. Tax cuts for U.S. corporations would allow them to keep more after tax cash flow. And the price of money vis-a-vis interest rates currently remains super low.
On the flip side, as we enter 2018, there will be pressures on all three of these fronts. An entire decade of near-zero percent rate policy and electronic money printing by central banks has forged an unsustainable debt path. Specifically, debts have been growing at a far faster pace than economies themselves.
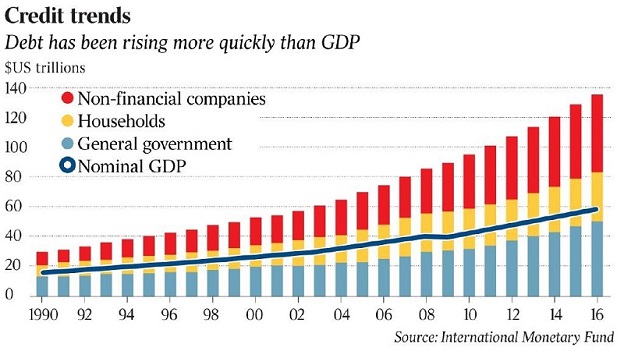
If borrowing rates could be counted on to stay as low as they are now, as well as move lower over time, debt servicing would not necessarily be an issue. However, the U.S. Federal Reserve is looking to “normalize” with a continuing campaign to raise overnight lending rates, as well as eliminating $420 billion from its balance sheet (a.k.a. “quantitative tightening” or “QT”). By the same token, the European Central Bank (ECB) intends to slow its asset purchases (a.k.a. “tapering”), which has the same effect as removing $500 billion in liquidity injections.
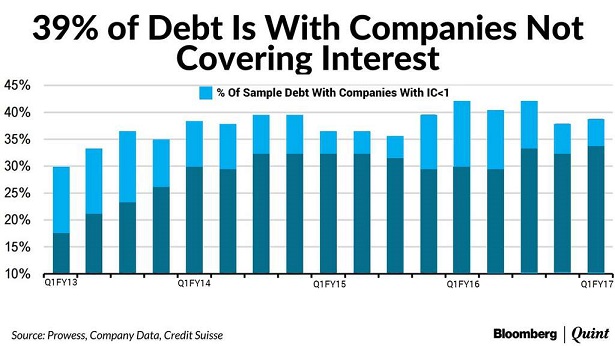
In essence, $920 billion less in asset price support for 2018 matters. After all, if 2016 and 2017 represented the fastest pace of global quantitative easing (QE) in the 2008-2017 period, wouldn’t deceleration in the pace of asset purchasing act as a headwind for equities? And what about corporations that can barely cover their interest payments, if at all?
Equally concerning, the investment community may not be adequately prepared for the possibility that record low volatility in both stocks and bonds picks up substantially. It might take little more than a singular shock to the proverbial system for a sharp reversal in volatility, with likely contagion causing panic sell-offs in risk assets.
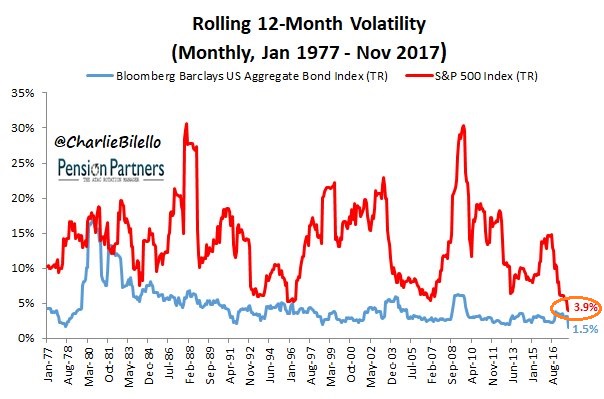
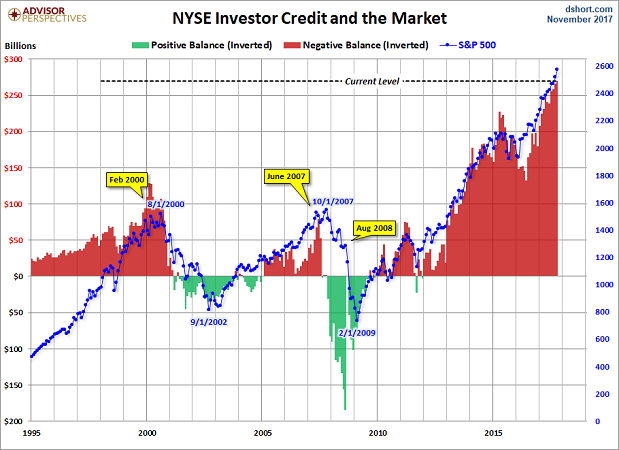
The fact that leverage in those risk assets has never been higher alongside an investment community that remains convinced that volatility can always be suppressed is troublesome. It is almost as if the investment community has forgotten what happens to stocks when margin debt unwinds and when credit balances in margin accounts swing from negative (red) to positive (green).
So why am I maintaining a 50%-57.5% allocation to stocks for my retiree and near-retiree client base? When an iceberg may be “Straight Ahead?” Two reasons. First, our tactical allocation has already lowered the percentage allocated to stocks and bonds such that we hold roughly 20% in cash equivalents. Our typical mix of 70% widely diversified equity and 30% widely diversified income is already more conservative.
Second, we would further preserve capital in portfolios if a technical breach occurred in the 10-month simple moving average; that is, if the monthly close on the 10-month SMA is below its trendline, we shift a much greater percentage to the safe harbor of money market accounts and other cash equivalents.
Disclosure Statement: ETF Expert is a web log (“blog”) that makes the world of ETFs easier to understand. Gary Gordon, MS, CFP is the president of Pacific Park Financial, Inc., a Registered Investment Adviser with the SEC. Gary Gordon, Pacific Park Financial, Inc., and/or its clients may hold positions in the ETFs, mutual funds, and/or any investment asset mentioned above. The commentary does not constitute individualized investment advice. The opinions offered herein are not personalized recommendations to buy, sell or hold securities. At times, issuers of exchange-traded products compensate Pacific Park Financial, Inc. or its subsidiaries for advertising at the ETF Expert website. ETF Expert content is created independently of any advertising relationship.
