Street Calls of the Week
So we finally have a bigger decline on the S&P 500. It is not very common for this market to drop more than 1%. What is more, we are on the track to have the worst month of performance in the recent history. Obviously we are all aware of the fact that stock traders in the United States are capable to lift the prices higher and even finish this month on the green side but let's leave those factors on a side and look on the technical side of the market.
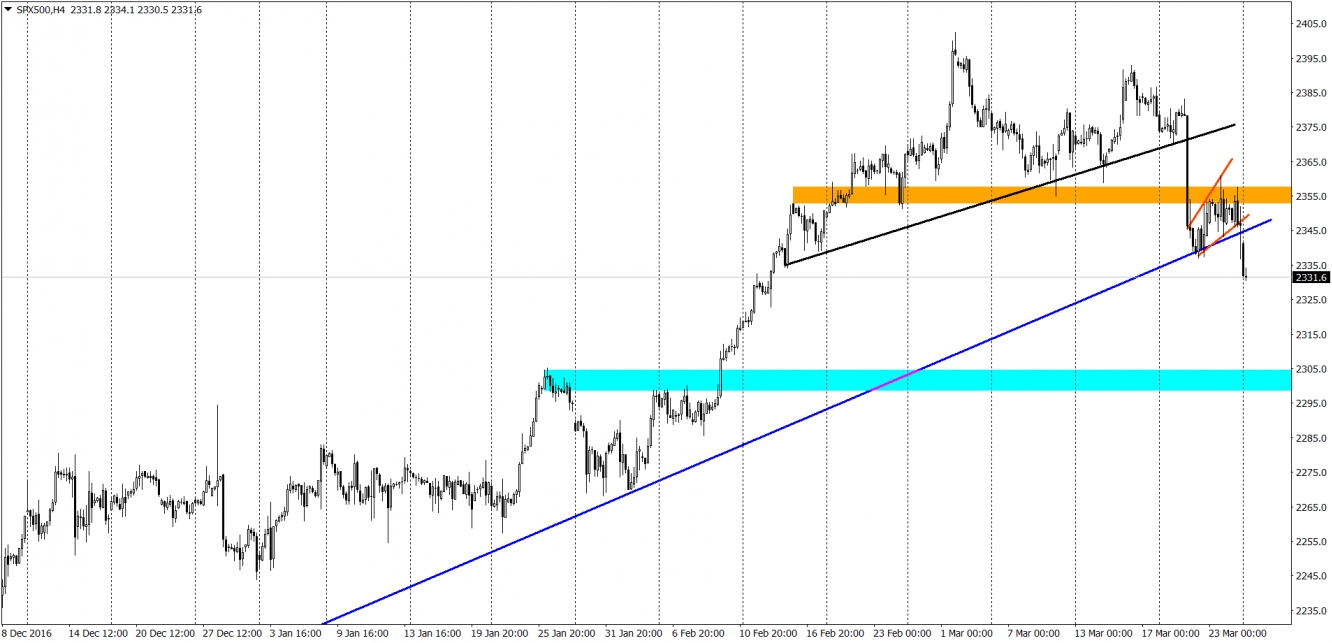
What we have here is the price breaking the mid-term support connecting recent higher lows (black line). After that, the movement accelerates and breaks the horizontal support (orange). The next step is a small correction (wedge, red lines) resulting in a bearish breakout but this time crossing an important up trendline (blue), which was connecting lows since the December.
All this creates a good chance to aim for the 2300 support (blue area). If stocks were not in the bubble phase (yes, we do think they are a bit pumped) that downswing would be highly probable. During bubbles, every dip is being bought rapidly so buyers can use those lower prices now and do not wait for the further weakness. If we put that on a side, 2300 is on the best way to be tested and this is the most probable scenario for us right now.

