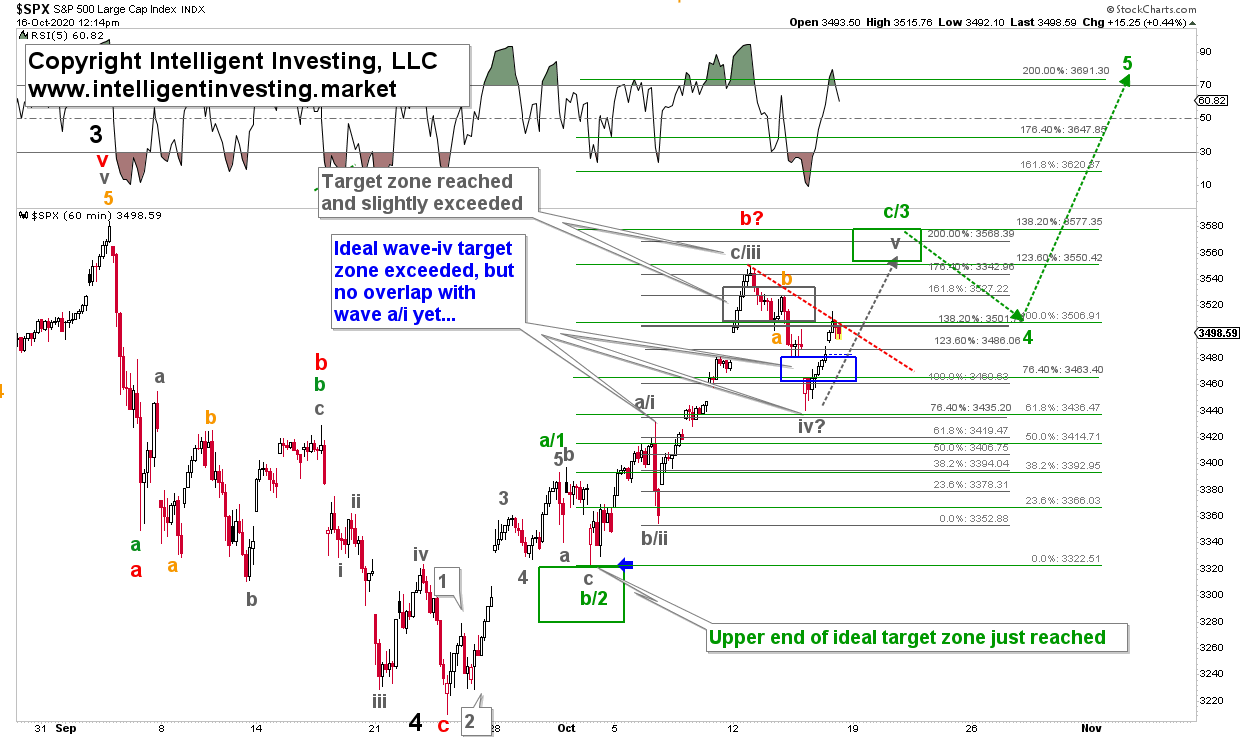
In Wednesday’s Premium Major Market’s Update I stated for my members: “Below SPX3465-60 and the impulse Elliott Wave count, as said yesterday, is under severe pressure. You can use these levels as stops against long entries if so desired.”
On Thursday the S&P 500 dropped to as low as SPX3440 and recovered. So, why did I state that? Because if an instrument – in this case the S&P500 – rallies to the 1.236 extension in a potential wave-iii of 3, it “should” hold the 0.764 extension (SPX3465-60 in this case) as support for wave-iv of 3, before rallying in wave-v of 3. See Figure 1 below.
Figure 1.

Note the “should” as that is the ideal/text-book pattern. But the market does not have to be text book. It often isn’t. That would be too easy, wouldn’t it? But it is all I can go by initially when forecasting the next move. Obviously, the market broke below that extension level yesterday at the open. That, in turn, already put pressure on the bullish sequence. The next, and last, level of support to keep the bullish thesis alive is the 0.618 extension. Below that and the prior rally was with 99% certainty not an impulsive rally, but a corrective rally. In this case, that 0.618x extension is SPX3435, which is pretty much where the market held (SPX3440). Thus, the bullish case is still alive, but hanging on by a thread. It would, however, not be the first time the bulls stick save it.
So, normally, if the 1.236 extension is hit like it was, and then price breaks below the 0.764 extension, it is – as said – a strong warning that the bullish EWP count is not playing out. I then have to questioning it and, as a trader, become more cautious. But, until the market actually breaks below the 0.618x extension at SPX3435, I do not know with certainty if the recent rally was a larger b-wave top (only three waves up), or only wave-iii of 3 of an impulse.
This is why one initially must always label each rally as a/1, b/2, c/3 until the market proofs it is indeed only three waves up (a, b, c) or an impulse up (1, 2, 3, 4, 5). That is the only honest way to label the price action. Anything else is informed bias. Yesterday the index was very close to proof the “three waves up” scenario. But close is no cigar. Thus, for as long price stays above SPX3435 we can look higher to ideally SPX3550-3575 for a possible (grey) wave-v of (green) wave-3. If the SPX breaks below that level then a c-wave down to the low SPX3200s has with 99% certainty started.
From a trading perspective: this is why one must always take profits on the way up. In this case, reduce long exposure in my grey target zone shown in Figure 1. I had already outlined to my premium members on Oct. 7, when the SPX was trading at 3420: “look for higher prices, and symmetry targets SPX3460-3540, as long as SPX3400 holds.” We got SPX3550 so far. And, this is why one must raise stops on remaining positions as the index moves higher towards those targets to make sure one doesn’t get caught on the wrong side fully exposed when the market does decide to go against you. This way profits are safeguarded and trading becomes less stressful. Remember the name of the game is to make money, not to hold a position the longest or to be right about the market.
If the market decides to move higher again after being stopped out at some point, one simply catches the next bus. It is as simple as that. No buts, no regrets. Place your stop accordingly (SPX3435) and, hopefully, the trade will work in your favor: rinse, lather and repeat.
