S&P Makes A Mockery Of Its Seasonal Tendency

Published 12/20/2018, 05:04 AM

Santa’s rally took another slap to the face yesterday with the S&P 500 closing firmly beneath the 2018 low. Currently trading -9.2% lower amid its worst month since February, the odds of a turnaround look bleak to say the least.

We’ve been tracking the top of the S&P 500 for a while and, while it currently lacks the ferocity of the 1987 top, it is giving the 2007 and 2000 bears a ‘run for their money’. If this does turn out to be a mere correction, it’s certainly an unpleasant one, especially given the time of year.
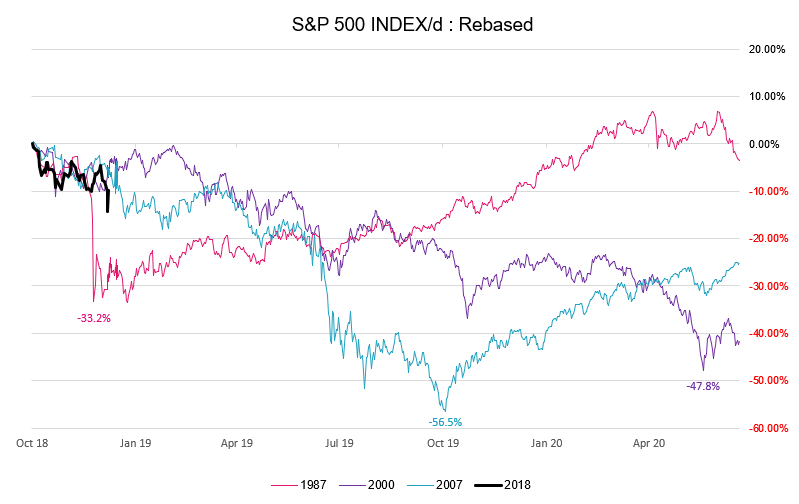
S&P 500 Index/d : Rebased

At -9.2% down for the month, the S&P 500 is making a mockery of its seasonal tendency. Over the past 30 years the index has averaged +1.48% a month and posted a positive close 80% of the time. Of the 6 bearish months in December, its average is -1.89% with the second worst sell-off being -6.1% in 2002. In fact, this is currently its third worst month using data from 1960.
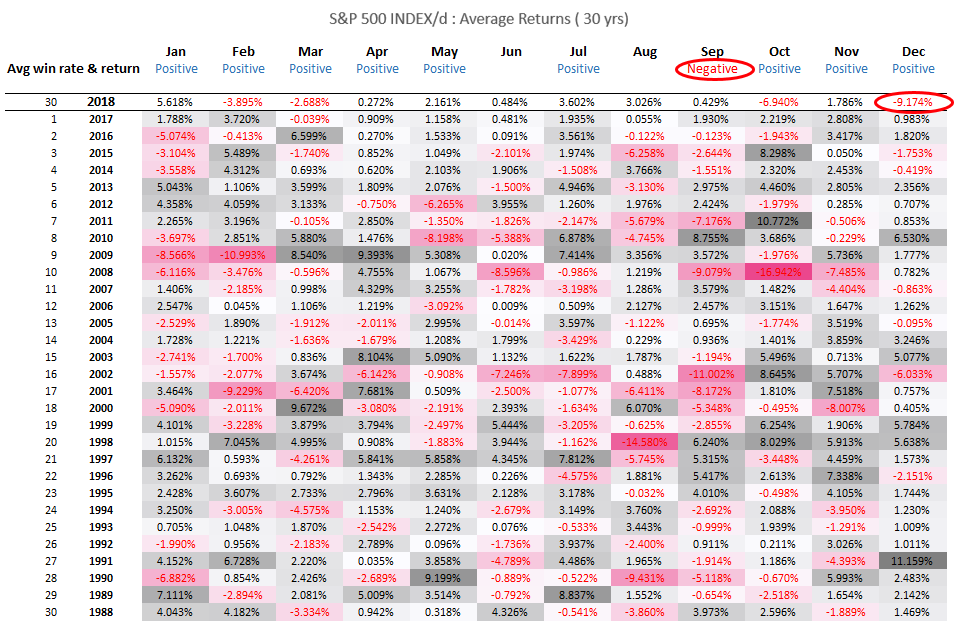
S&P 500 Index/d Average Return 30 Yrs

A simpler way of looking at the seasonal table is to only count a month as ‘positive’ if the month gains on average over 50% of the time, or ‘negative’ for bearish months over 50% of the time. From this angle, the only negative month tends to land in September. So, if Santa is banking on a positive close this month, he could well be on the dole by January.
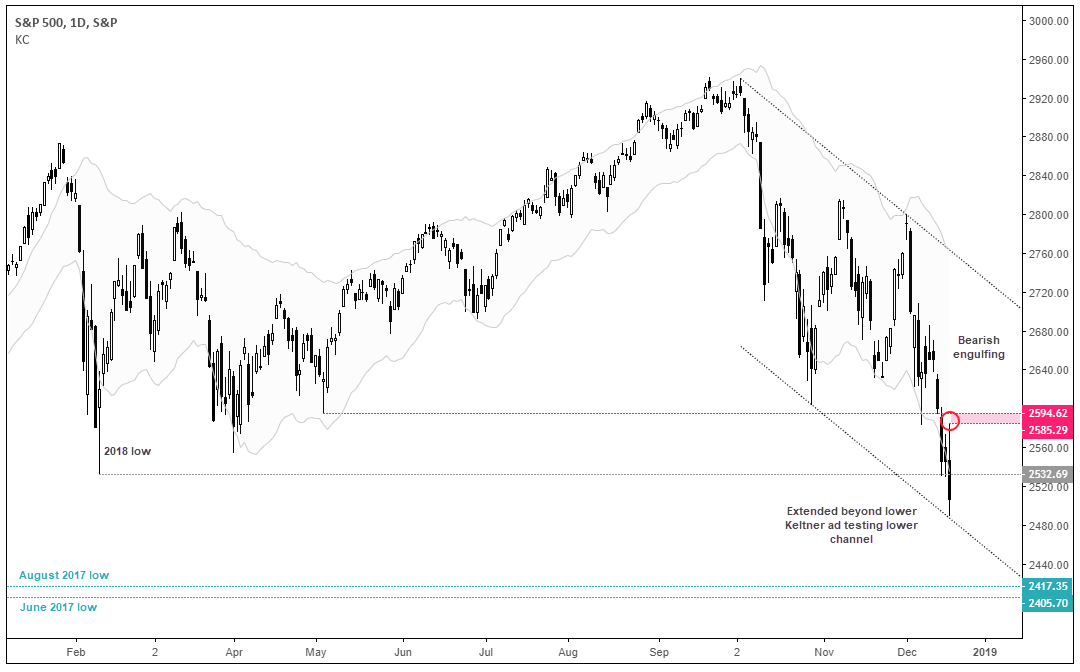
S&P 500 1 Day S&P Chart

Technically, the daily trend structure is firmly bearish and yesterday’s outside day closed beneath the 2018 low. There’s a risk that the near-term is overextended to the downside as it trades beyond its lower Keltner band. Moreover, yesterday’s low perfectly tested the lower trendline of a bearish channel.

Still, with the index being so emotionally charged, we’d question any urge to buy at these lows. We’d prefer to stick with momentum and wait for prices to consolidate or retrace to an area of resistance, such as the 2585.29-2594.62 resistance zone. Ultimately, we think momentum will take this down towards the June and August lows around 2405.70-2417.35.

Original post

Latest comments

Loading next article…
Risk Disclosure: Trading in financial instruments and/or cryptocurrencies involves high risks including the risk of losing some, or all, of your investment amount, and may not be suitable for all investors. Prices of cryptocurrencies are extremely volatile and may be affected by external factors such as financial, regulatory or political events. Trading on margin increases the financial risks.
Before deciding to trade in financial instrument or cryptocurrencies you should be fully informed of the risks and costs associated with trading the financial markets, carefully consider your investment objectives, level of experience, and risk appetite, and seek professional advice where needed.
Fusion Media would like to remind you that the data contained in this website is not necessarily real-time nor accurate. The data and prices on the website are not necessarily provided by any market or exchange, but may be provided by market makers, and so prices may not be accurate and may differ from the actual price at any given market, meaning prices are indicative and not appropriate for trading purposes. Fusion Media and any provider of the data contained in this website will not accept liability for any loss or damage as a result of your trading, or your reliance on the information contained within this website.
It is prohibited to use, store, reproduce, display, modify, transmit or distribute the data contained in this website without the explicit prior written permission of Fusion Media and/or the data provider. All intellectual property rights are reserved by the providers and/or the exchange providing the data contained in this website.
Fusion Media may be compensated by the advertisers that appear on the website, based on your interaction with the advertisements or advertisers.
© 2007-2025 - Fusion Media Limited. All Rights Reserved.