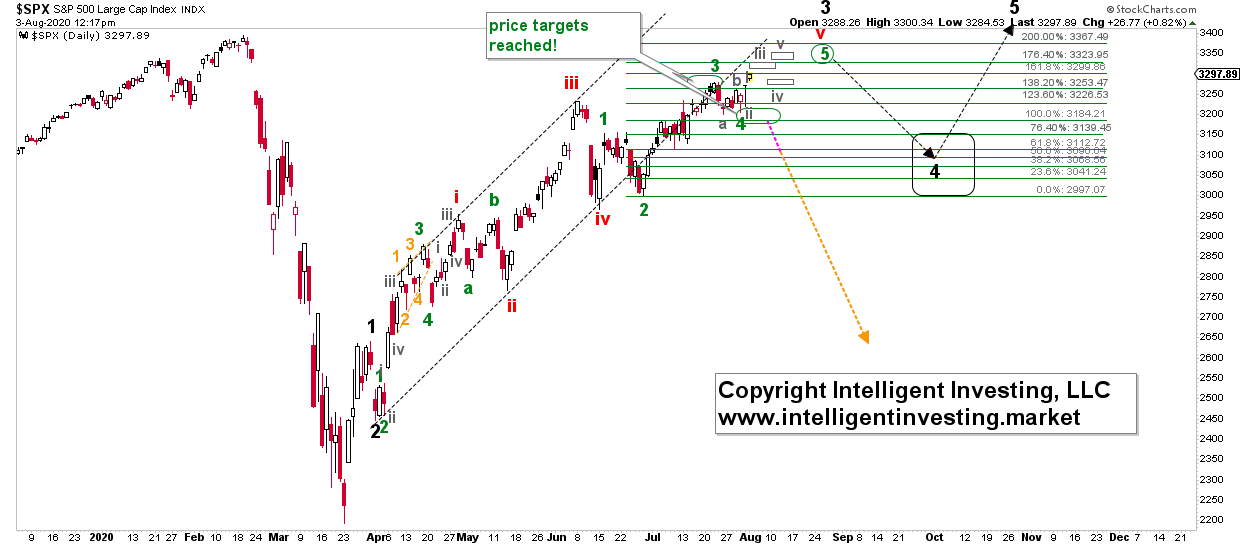
Using the Elliott Wave Principle, I find the S&P 500 to be in an impulse higher to around 3323-3367. See Figure 1 below.
As long as last week’s low holds, the index is now, ideally, in (grey) minute wave-iii to preferably around 3310-3320, followed by a (grey) minute-iv to around today’s low and the last (grey) wave-v to 3330-3340. These targets are based on typical 3rd, 4th and 5th wave extensions. The latter price target fits well with the 3323-3367 zone.
Figure 1. S&P 500 daily candlestick chart with EWP count.

Once the index has reached this low- to mid-3300s zone, I expect a more significant correction, right on cue for the often-weak August summer month. This correction would then be a larger 4th wave to around SPX 3140-3000. Since in bull market's upside often surprises and downside disappoint, I prefer to look at the upper end of that target zone. Besides, the SPX 3110-3140 level is strong support. Once this correction has run its course, then the last wave-5 of the impulse move that started from the infamous March 23 low should kick in. Since 5th waves are typically between 0.618 to 1.00x wave-1 and wave-1 was around 400p, I calculate an ideal target of SPX 3360-3540, with the upper end preferred.
Moreover, 5th waves in the market are often extended, i.e., longer than “normal,” and SPX 3600-4000 can, therefore, not be excluded at this stage.
But let’s not run too far ahead of ourselves, and focus on the current rally to around SPX 3330-3340 first. Then, we can see what happens from there and set our sails for the next two larger moves: down and up.
