S&P 500: Triangle Pattern Leads To New Record High

Published 11/08/2019, 05:52 AM
Updated 07/09/2023, 06:31 AM
US500
-

The S&P 500 reached new all-time highs on the back of better-than-feared earnings season and improved US-China trade prospects. The index closed at 3085 Thursday, bringing its 2019 tally to the impressive 23.1%.
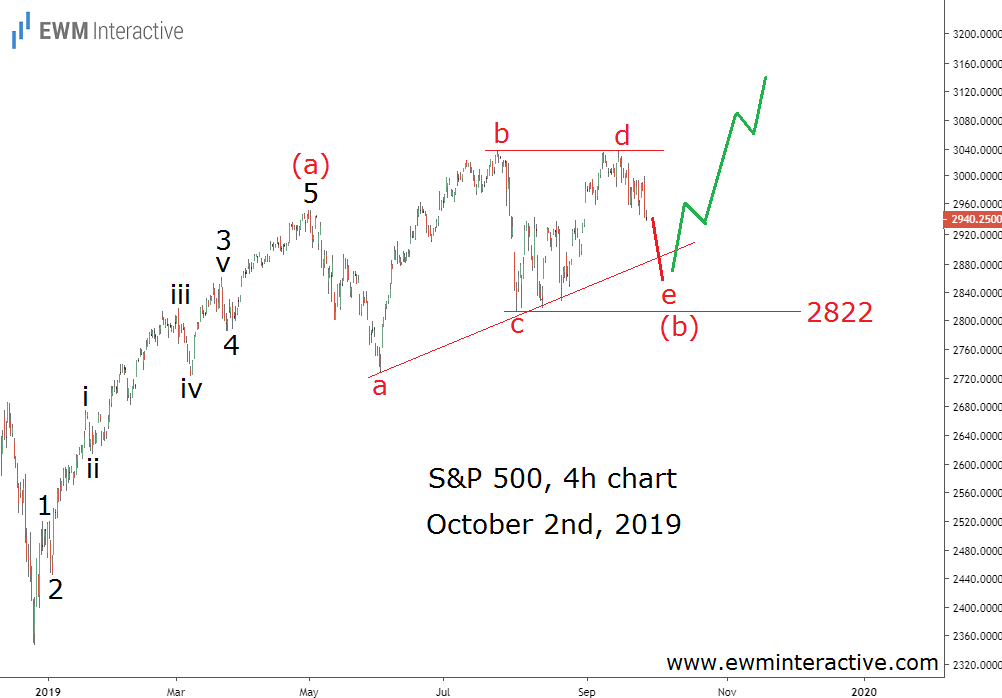
S&P 500 4 Hr Chart - Oct 2nd, 2019

But was there a way to predict this move instead of just explaining it after the fact? To paraphrase Warren Buffett, the trader of today does not profit from yesterday’s growth. In other words, traders must be able to anticipate the market’s next move. The chart below, shows how this can be done with the help of Elliott Wave analysis.

The 4-hour chart put the S&P 500 ‘s entire 2019 progress into Elliott Wave perspective. It revealed that the recovery from 2346 to 2954 was a five-wave impulse, labeled 1-2-3-4-5 in wave (a). The rest seemed to be an almost complete a-b-c-d-e triangle pattern in wave (b).

This meant that more strength in wave (c) towards 3100 could be expected as soon as wave “e” completes the triangle. In addition, the analysis helped us identify a specific invalidation level for this bullish count. Wave “e” was not supposed to breach the bottom of wave “c” at 2822. Over a month later now, the updated chart below shows how things went.
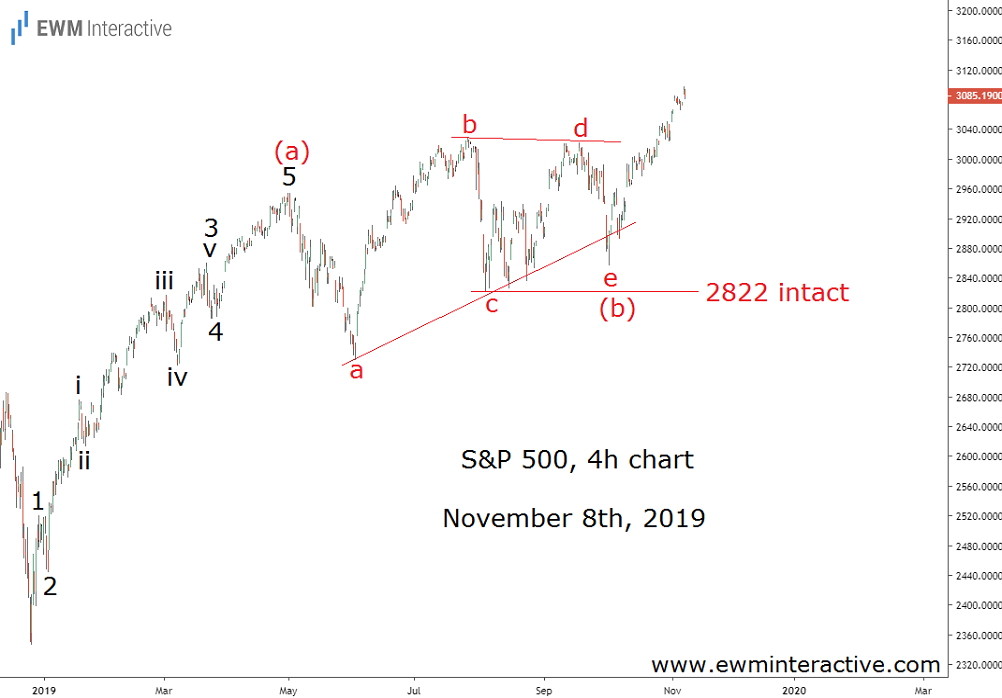
S&P 500 4 Hr Chart - Nov 8th, 2019.png

Wave “e” ended at 2856 on October 3rd, comfortably above the 2822 invalidation level. At that point the impulse-correction wave cycle was complete and it was time for the bulls to return. Nearly 230 points to the north later, we can say that all the positive market-related news certainly helped the S&P 500. However, we don’t think it caused the rally since there was a complete bullish pattern already in place

Original Post

Latest comments

Loading next article…
Risk Disclosure: Trading in financial instruments and/or cryptocurrencies involves high risks including the risk of losing some, or all, of your investment amount, and may not be suitable for all investors. Prices of cryptocurrencies are extremely volatile and may be affected by external factors such as financial, regulatory or political events. Trading on margin increases the financial risks.
Before deciding to trade in financial instrument or cryptocurrencies you should be fully informed of the risks and costs associated with trading the financial markets, carefully consider your investment objectives, level of experience, and risk appetite, and seek professional advice where needed.
Fusion Media would like to remind you that the data contained in this website is not necessarily real-time nor accurate. The data and prices on the website are not necessarily provided by any market or exchange, but may be provided by market makers, and so prices may not be accurate and may differ from the actual price at any given market, meaning prices are indicative and not appropriate for trading purposes. Fusion Media and any provider of the data contained in this website will not accept liability for any loss or damage as a result of your trading, or your reliance on the information contained within this website.
It is prohibited to use, store, reproduce, display, modify, transmit or distribute the data contained in this website without the explicit prior written permission of Fusion Media and/or the data provider. All intellectual property rights are reserved by the providers and/or the exchange providing the data contained in this website.
Fusion Media may be compensated by the advertisers that appear on the website, based on your interaction with the advertisements or advertisers.
© 2007-2025 - Fusion Media Limited. All Rights Reserved.