The last few months have been hard on stock-market bulls, to put it lightly.
Only three short months ago, the S&P 500 was trading up by 10% on the year, on track for its 10th straight positive year on a total return basis. Now, the index is trading down by nearly 8% on the year (excluding dividends) and down a staggering 16% from the late September high. In fact, the S&P 500 has shed 11.5% of its value over just the last 12 trading days alone.
What’s Changed?
Certain politically motivated analysts will no doubt point out that the market’s latest drop kicked off on the same day President Trump tweeted that he was a “tariff man,” and it’s certainly true that global trade tensions are taking a toll on global economic growth. Of course, other analysts (and surely the president himself) will highlight that stocks are down nearly 5% from Wednesday afternoon’s Federal Reserve meeting, where Fed Chairman Powell raised interest rates and refused to consider tweaking the central bank’s balance-sheet program.
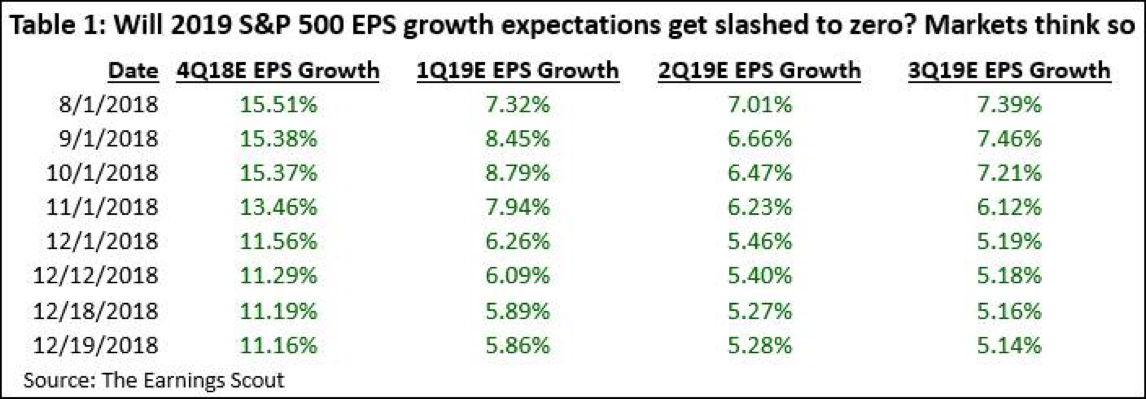
At the end of the day, though, earnings are what drives the stock market and as the tailwind from last year’s massive tax-cut bill fades, expectations for earnings growth are coming down as the post-GFC economic recovery reaches its 10th year. As the earnings mavens at FactSet note, “estimated earnings for the fourth quarter have fallen by 3.2% since September 30. This percentage decline is larger than the 5-year average (-3.1%) for a quarter.” Perhaps more importantly for forward-looking traders, analysts have been slashing their growth expectations for 2019, with expectations of just 5-6% annualized earnings growth through the first three quarters of next year.

Source: @TheEarningsScout
As the above graphic shows, these expectations are down sharply from analysts’ expectations in October, and concerningly, they show no sign of forming a meaningful bottom yet. While the few companies that have reported Q4 earnings so far have seen generally decent results (with the notable exception of concerning results out of FedEx (NYSE:FDX), markets will have to wait for the new year before growing more optimistic on an earnings-based stabilization in stocks.
S&P 500 Technicals
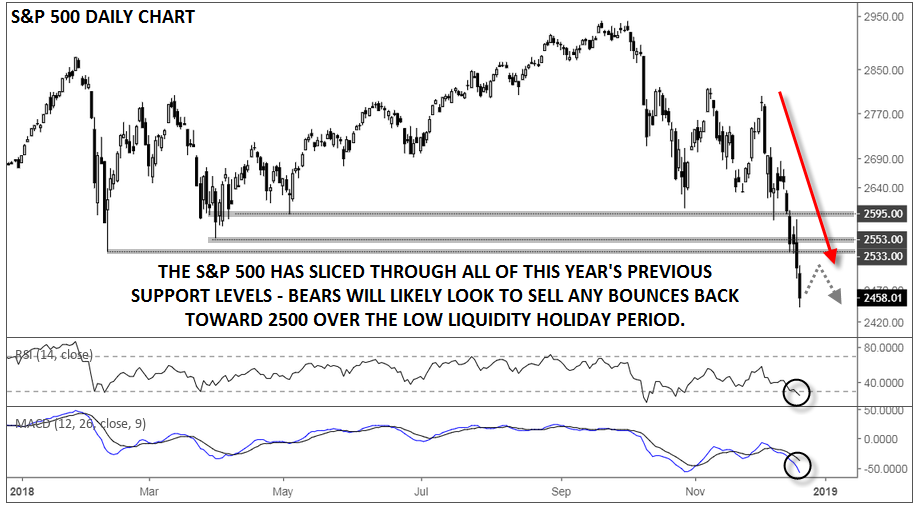
The chart of the S&P 500 shows how damaging the recent drop has been for US stocks. Two weeks ago, bulls could argue that the index hadn’t yet made a meaningful “lower low” and was holding above the support levels from the first half of the year. Now, however, the index has sliced through all of those support levels, clearing the way for a further drop toward the Q3 2017 lows in the 2400-2420 region. Below there, bears may target the lows around 2300 or the mid 2250s.
The RSI indicator shows that prices are in oversold territory, raising the prospect of a possible bounce in the coming days, but with the MACD trending lower below both its signal line and the “0” level, the trend remains definitively bearish. In the short term, bears will likely look to sell any bounces back toward the 2500 level, with bulls on the defensive unless the S&P 500 can climb back above 2600.

Source: TradingView, FOREX.com
Cheers
