- The S&P 500's slow start in 2024 aligns with historical patterns, suggesting a potential second-half rally.
- Microsoft's recent takeover of Apple as the world's most valuable company raises questions about Apple's sustainability.
- Meanwhile, Netflix's strategic shifts in 2023 set the stage for a potential resurgence in 2024.
- Looking to beat the market in 2024? Let our AI-powered ProPicks do the leg work for you, and never miss another bull market again. Learn More »
After a positive year with S&P 500's performance exceeding 20%, slow starts, like the one we've encountered, are a common occurrence.
Historically, these sluggish beginnings often culminate in surprising endings, marked by a potential rally in the second half of the year. Therefore, encountering some weakness at this stage is a normal part of the process. 
This same slow start and annual trend occurs in election years, in which we are now. After the first few dull months, we generally then see a bullish trend for the rest of the year. 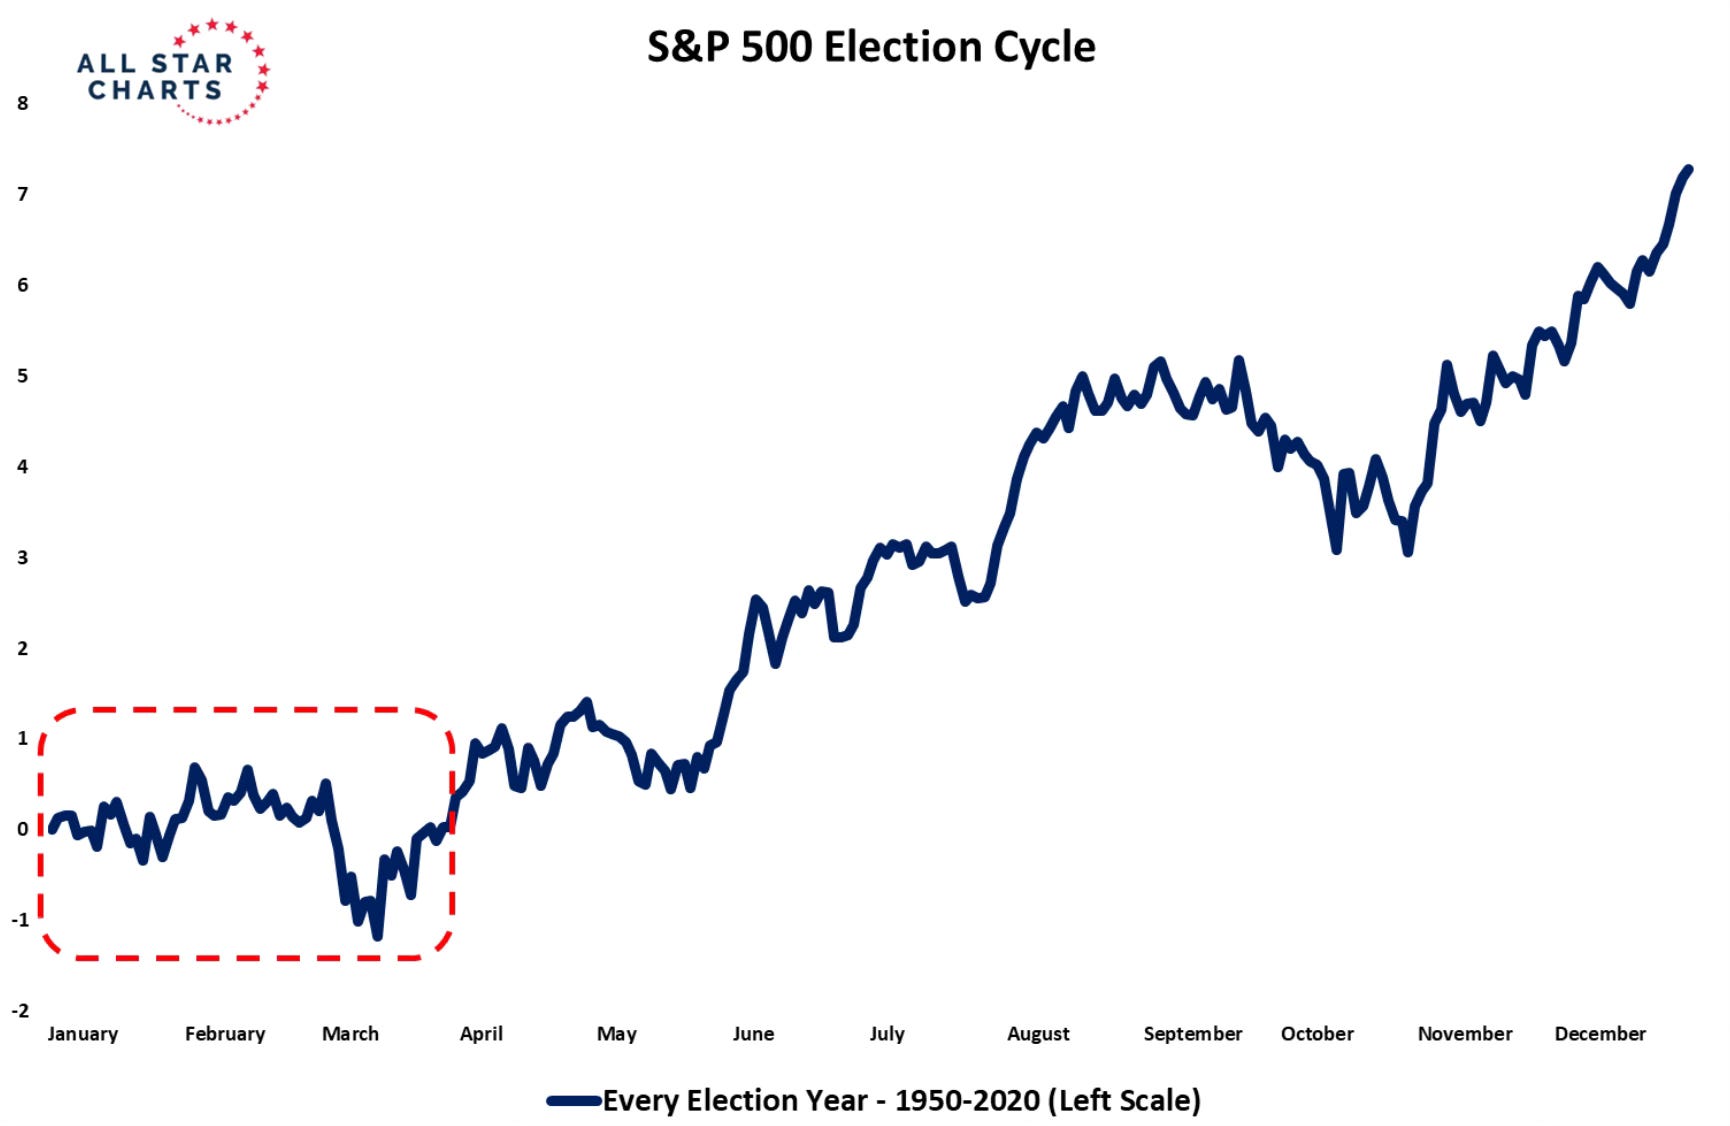
The chart above shows the S&P 500, from 1950 to 2020, as it performed in each election year throughout the year.
This could be considered a good point to see a similarly positive 2024, as history shows us that outperformance is likely to come in the second half of the year.
Microsoft to Take Over From Apple as the Most Valuable Company in the World?
Last week witnessed a shift in the ranking of the world's most valuable companies, with a new leader emerging.
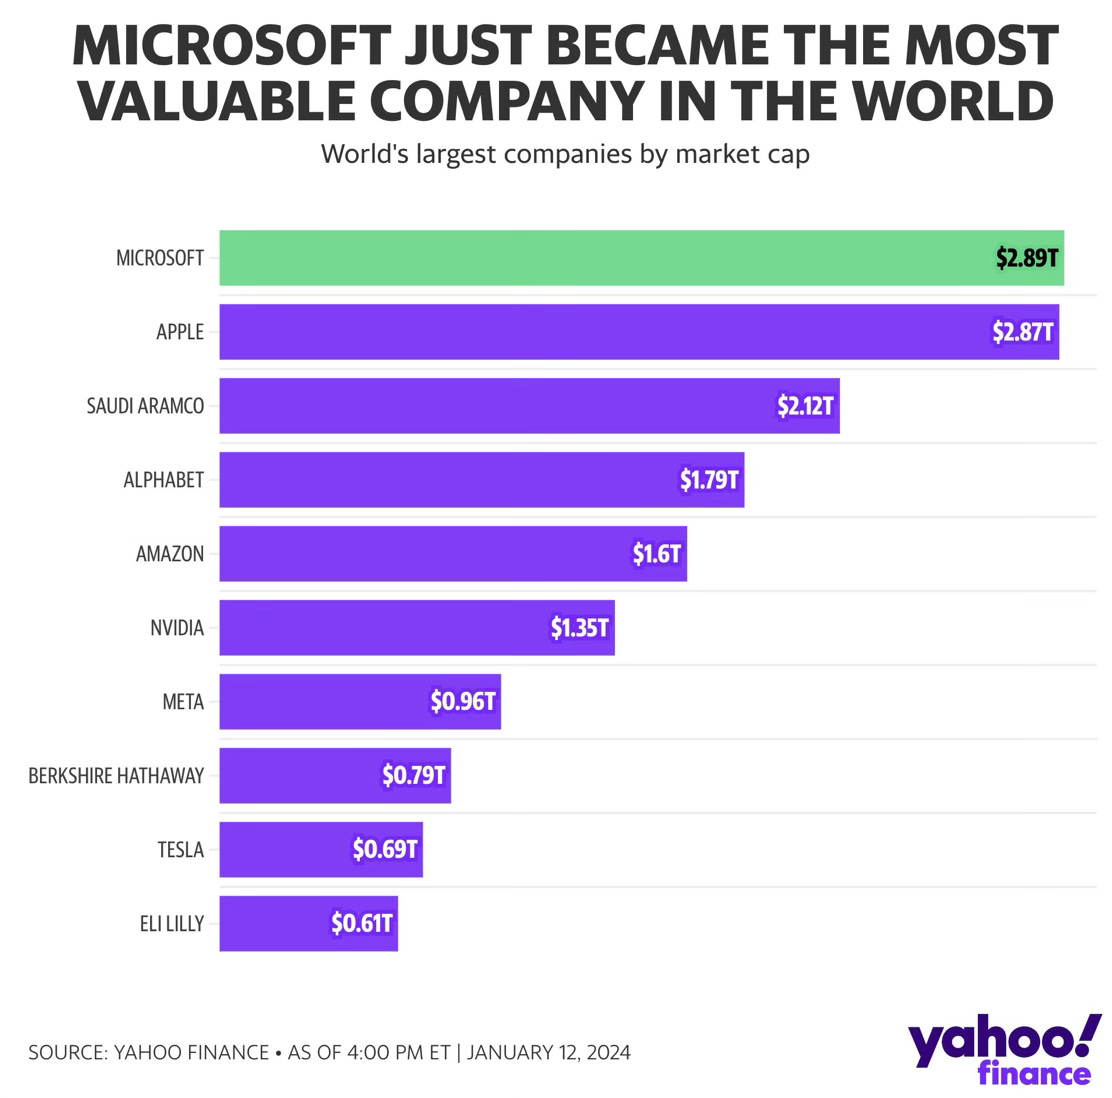
Microsoft (NASDAQ:MSFT) overtook Apple (NASDAQ:AAPL) in first place, becoming the largest company by market capitalization.
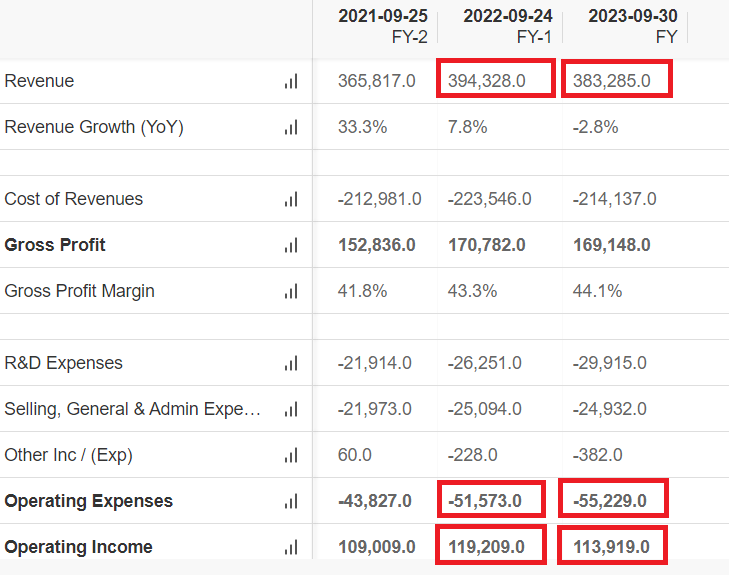
Apple has not had a particularly outstanding year. Over the past twelve months, revenue has declined, expenses have increased, and operating profit has declined. Earnings per share increased by cents due to share buybacks.
Source: InvestingPro
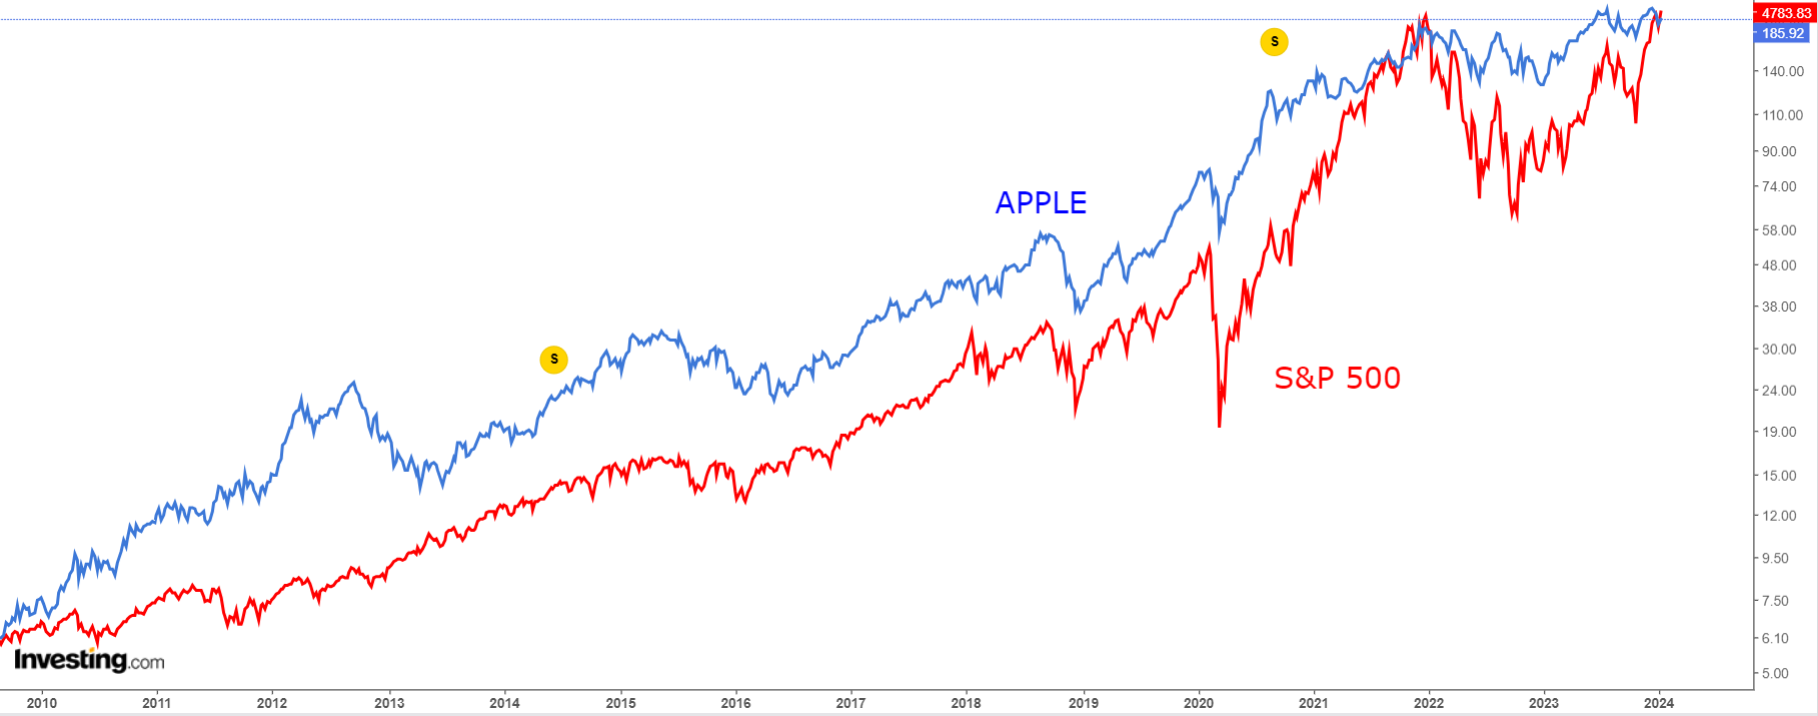
Although it has struggled to grow, the stock has had another banner year for its shareholders, with a gain of about +50%.
Not only that, if we look at the average performance since 2010, it has had an annual return of 31 percent, which is 18 percent more than the S&P 500.
Apple's shares have also been helped by expanding multiples. it started 2023 with P/E Ratio at 22.3x and finished the year with 29.6x. Valuations are objectively among the highest in the last decade (with no growth to support them, moreover).
Source: InvestingPro
Could it underperform the S&P 500 and be removed from the Magnificent 7?
Meanwhile, 2024 holds promising prospects for Netflix (NASDAQ:NFLX) following its rollercoaster journey of rise, fall, and resurgence. In 2022, it experienced a significant dip, losing 75 percent from its all-time highs.
However, strategic shifts in 2023, including the integration of advertising and the crackdown on password sharing, fueled a robust bullish trend, yielding a remarkable +66 percent year-on-year growth.
The question now lingers: could Netflix reclaim its position among the Magnificent 7 in 2024?
Finally, here is a possible bearish pattern on Apple's chart.
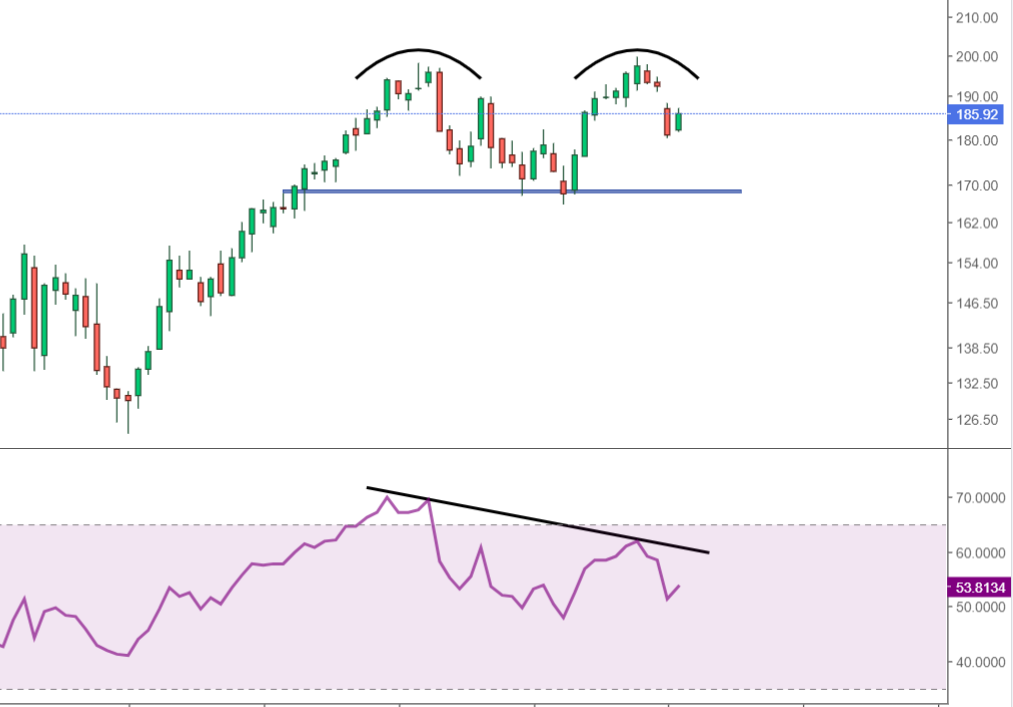
This indicates a possible reversal of the trend, double highs are formed when the price reaches a resistance area twice and fails to overcome it.
These are two consecutive price spikes, generally at similar levels, suggesting precisely that selling pressure may exceed buying pressure.
In addition, double highs tend to provide a stronger signal when a divergence with the RSI indicator is created at the same time, as in our case.
This could occur by looking, of course, in the short term.
But every asset is bound, sooner or later, to experience positive periods and just as many negative periods. The difficult part to find out, as always, is the duration of each.
***
In 2024, let hard decisions become easy with our AI-powered stock-picking tool.
Have you ever found yourself faced with the question: which stock should I buy next?
Luckily, this feeling is long gone for ProPicks users. Using state-of-the-art AI technology, ProPicks provides six market-beating stock-picking strategies, including the flagship "Tech Titans," which outperformed the market by 670% over the last decade.
Disclaimer: This article is written for informational purposes only; it does not constitute a solicitation, offer, advice, or recommendation to invest as such it is not intended to incentivize the purchase of assets in any way. I would like to remind you that any type of asset, is evaluated from multiple points of view and is highly risky and therefore, any investment decision and the associated risk remains with the investor.

