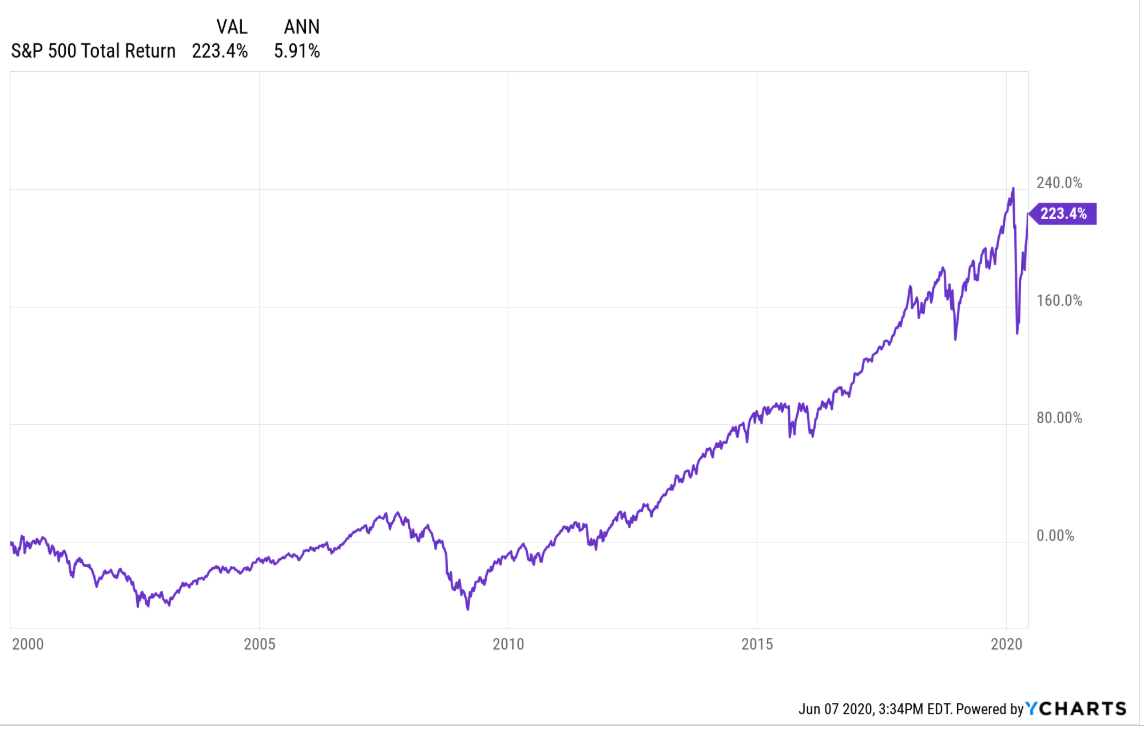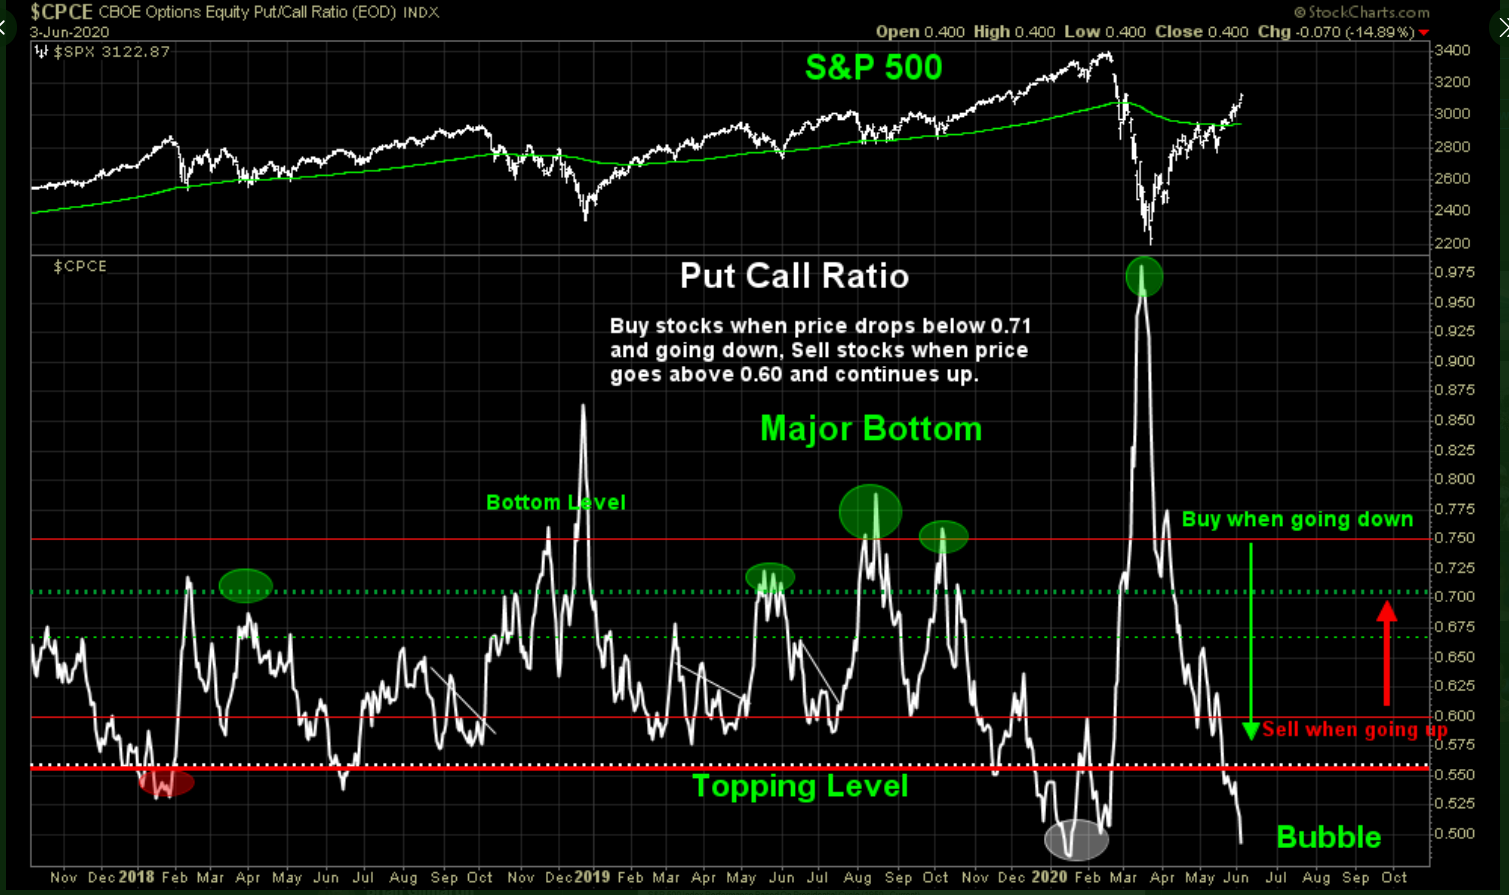
This chart is checked every 3 – 6 months.
The “average, annual” return on the S&P 500 from 1/1/200 is 5.91%, still below the 7% long-term, post-WW II average (with a shout-out to all American vets the day after the anniversary of June 6, 1944.)
The average, annual return as of 12/31/19 was 6.05%.
As a Morningstar follower, I’ve always liked their “moat-centric” research. Morningstar was out in March ’20 – actually right in the middle of the 30% correction – saying that COVID-19 would not be a longer-term impairment to the S&P 500 valuation.
Morningstar now thinks the S&P 500 is fairly valued per this article picked up Abnormal Returns. Clients are still overweight in Financials and have been for a few years. Last week, the Financial Select Sector ETF (NYSE:XLF) was swapped for Goldman Sachs (NYSE:GS), which is still trading below the book value of $220 per share, closing Friday, June 5th at $217.92 per share. Some of the XLF was swapped for Bank of America (NYSE:BAC), but the majority was swapped for GS. JPMorgan Chase (NYSE:JPM) remains the client’s largest Financial sector holding, while The Charles Schwab (NYSE:SCHW) is the second-largest holding.
Goldman Sachs closed above its 200-day moving average for the first time since mid-February ’20 last week.
Some think the Financial’s got a bump from the steeper yield curve this week, but the 10-30’s was little changed. However, the 2’s – 10’s spread gapped 20 basis points wider.

This blog has been early and wrong on our Emerging Markets weighting. The weighting consists of two positions: the Vanguard FTSE Emerging Markets ETF (NYSE:VWO) and the OakMark International Fund (OAKIX). The VWO rose 7.79% last week (somewhat surprising to me about the VWO was the 12-month yield – per Morningstar data – of 3.78%). The OakMark International Fund rose 14%, last week, and is #1 in its peer group the last week and month. Maybe, more importantly, OAKIX is still in the 99th percentile of its peer group YTD. David Herro likes to buy what’s out-of-favor. European banks and auto’s populate the Top 10 OAKIX positions.
The weak dollar the last few weeks helped. The dollar as measured by the UUP ETF is now oversold.

Great chart from my favorite Kiwi technician (and probable All-Blacks fan) Callum Thomas. (All-Blacks in the name of new Zealand’s national rugby squad, arguably, the best rugby team in the world.)
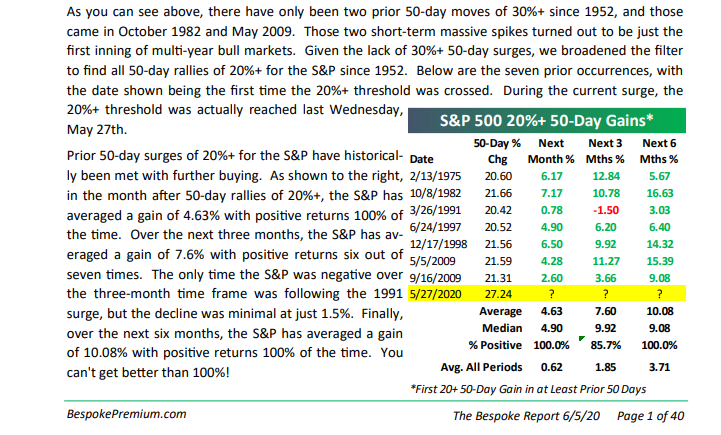
However, Bespoke noted again in their weekly Bespoke Report published Friday night, June 5, 2020, the buying surge since March 23rd’s low has traditionally been a harbinger of better returns to come:

Don’t ignore corporate bonds:

This spreadsheet was cobbled together when a big chunk of the client’s money market cash was moved into corporate bond funds when Jay Powell came out lowered fed funds back to zero and instituted QE4.
Look at the return improvement in the last 12 – 13 weeks.
Only Corporate high-yield credit and Emerging Market credit are still negative for YTD 2020.
Nuveen’s High Yield Municipal Fund managed by John Miller is lagging a little in terms of YTD returns, but municipal credit moves slower than corporate credit AND the duration on high-yield muni’s is much longer than the duration in corporate high-yield or even corporate high-grade.
Summary/conclusion:
If readers are worried about S&P 500 levels and valuation, seek out some of the sectors that were truly crushed from mid-February ’20 through March 23rd, ’20, like Financials, Emerging Markets, and also (according to Morningstar), Energy and Industrials.
Take everything you read here with substantial skepticism and a grain of salt. The markets can change quickly.
This piece was written to try and sway myself one way or the other in terms of market. Given the Bespoke analysis and pattern cited around similar +25% moves in short periods of time typically portends positively for “expected” or forward S&P 500 returns.
The other hallmark of this market the last few years is that sentiment tends to turn very bearish without much of a move to the downside.
A 2% 3% pullback would be perfect.
