Market participants are increasingly aware of how the options markets can influence the equity markets. This can be characterized as the “tail wagging the dog.” As a result, our quantitative research firm focuses on signals that come from the options market. We provide an update on our options signals below.
Summary Update
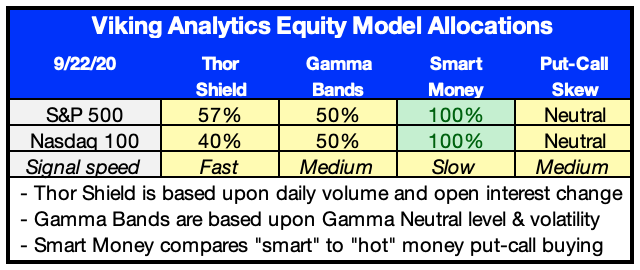
We created three indicators to test the effectiveness of reducing equity exposure using options data. These indicators are long-only, and all improve risk-adjusted returns in the back-test. A current summary of our portfolio allocations is below, and a brief summary of a few of the indicators is included below.
Gamma Bands
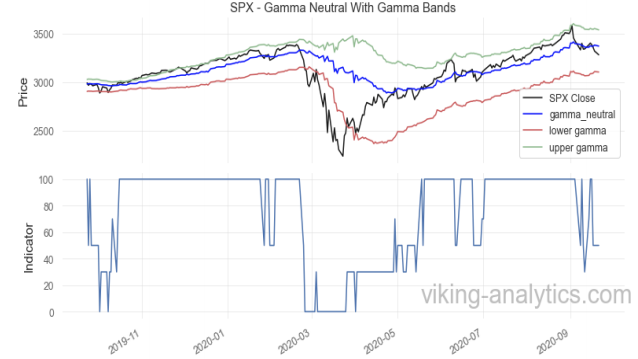
Our Gamma Band indicator looks at the relationship between the value of the S&P 500 (SPX) and the current Gamma Neutral and other levels to adjust equity exposure proactively.
In this model, we adjust our long-only equity allocation by reducing exposure when the options markets indicate higher risk. This signal can adjust daily but will remain 100% long in a strong uptrend. Following this signal would have improved risk-adjusted returns by over 70% since 2007.
The table below shows the current relationship of SPX to the Gamma Bands, with the percent allocation indicator as the second chart.
Smart Money Residual Index
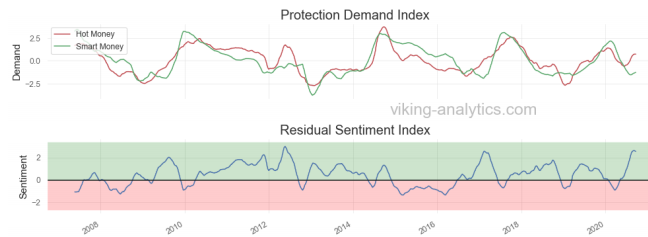
This indicator compares “smart money” options buying versus “hot money” options buying. Generally, smart money will purchase options to ensure stable returns over a longer-term. Smart money has in-depth knowledge and data in support of their options activity. In contrast, “Hot money” acts based on speculation, seeking a large payoff.
At the moment, hot money is more cautious than smart money, and the back-test supports a long position during this time. When the Residual Sentiment Index in the second graph turns to red, then this model will cut all equity exposure to zero. When the market is in the red regime below, the market has an overall negative return.
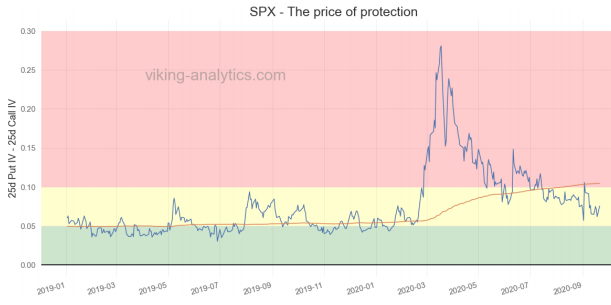
SPX Skew – The Price Of Protection
In evaluating equity market risk, we also consider the cost of buying puts versus the cost of buying calls. When puts command a larger-than-usual premium to calls, then the market is in a high risk mode (in the red zone below), and we would reduce our equity exposure. We consider skew to be neither bullish nor bearish at the moment.