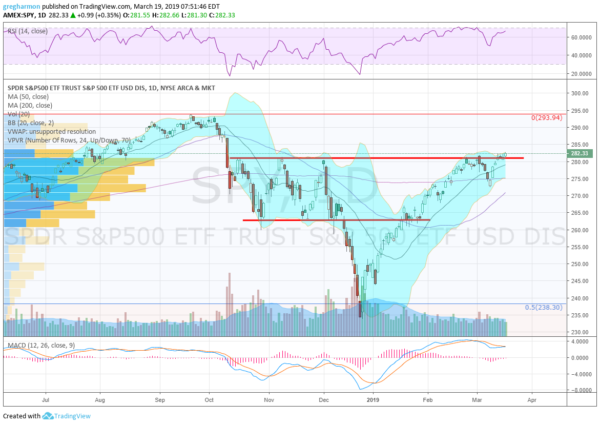
After a strong trend higher from an April 2018 low the S&P 500 topped out at the end of September last year. The price action that followed was very interesting. A quick two-week pullback and then a pause. The next two months saw a churn in a range, neither bullish or bearish with the price action bouncing off support and rising to resistance.
The volume profile on the left side of the chart of the S&P 500 ETF, $SPY, below is outsized compared to that either above or below it. This highlights the battle between buyers and sellers in this range. We know that in December the price dropped further in a climactic selling spree to a low on Christmas Eve.

What has happened since is most interesting. Nearly a straight move higher, a “V” bottom back to that range. It paused only a week before continuing up to the top of the range. The first hit at the top met with resistance and it pulled back to a higher low. The reversal from there brought price back to resistance last week. Now the price is clearing that prior range, moving into a volume air pocket.
It has chewed through the battleground of buyers and sellers and rising. Momentum remains strong with the RSI rising in the bullish zone and the MACD positive and about to cross up again. A Golden Cross appears to be a week or so away. And the Bollinger Bands® are opening to the upside. It appears that the next battleground will be the all-time high. Will a triple top stop the S&P 500 or will weak sentiment spur a FOMO buying spree that pops it to new all-time highs?
The information in this blog post represents my own opinions and does not contain a recommendation for any particular security or investment. I or my affiliates may hold positions or other interests in securities mentioned in the Blog, please see my Disclaimer page for my full disclaimer.
