- SPX Monitoring purposes; Sold long 4/9/21 SPX at 4128.80= gain 6.16%; Long SPX on 3/24/21 at 3889.14.
- Monitoring purposes GOLD: Long GDX (NYSE:GDX) on 10/9/20 at 40.78.
- Long Term SPX monitor purposes; sold long SPX on 1/15/21 at 3768.25= gain 10.80%; Long SPX on 10/26/20 at 3400.97

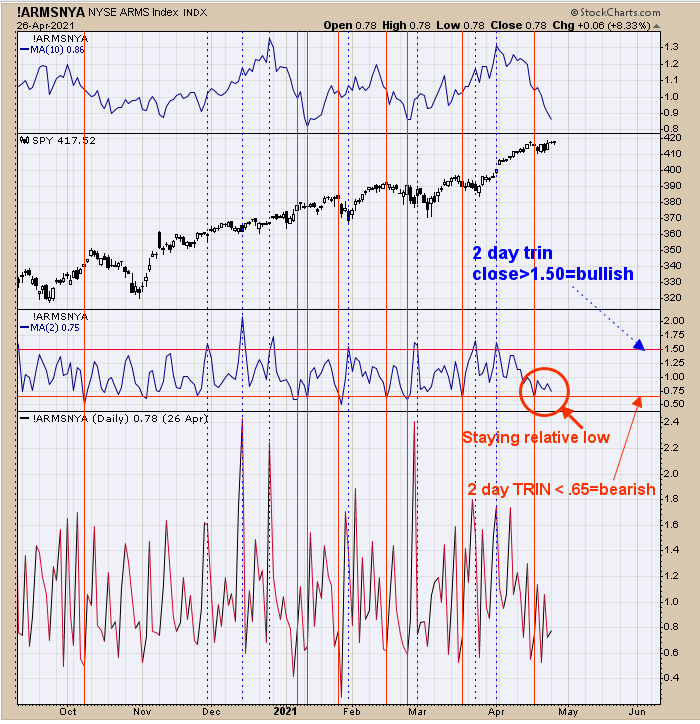
The middle window in the above chart is the two day average of the TRIN; readings above 1.50 are bullish for the market and below .65 are bearish.
Today’s close comes in .82 and leans bearish; a reading above 1.00 would lean bullish.
The dotted blue vertical lines are times when the two day average of the TRIN was above 1.50 and the red vertical lines are when the two day average TRIN was below .65. SPX may move sideways this week as upside appears limited for now as the relative low TRIN readings are not near the fear level needed to push the market higher.
Staying neural for now.

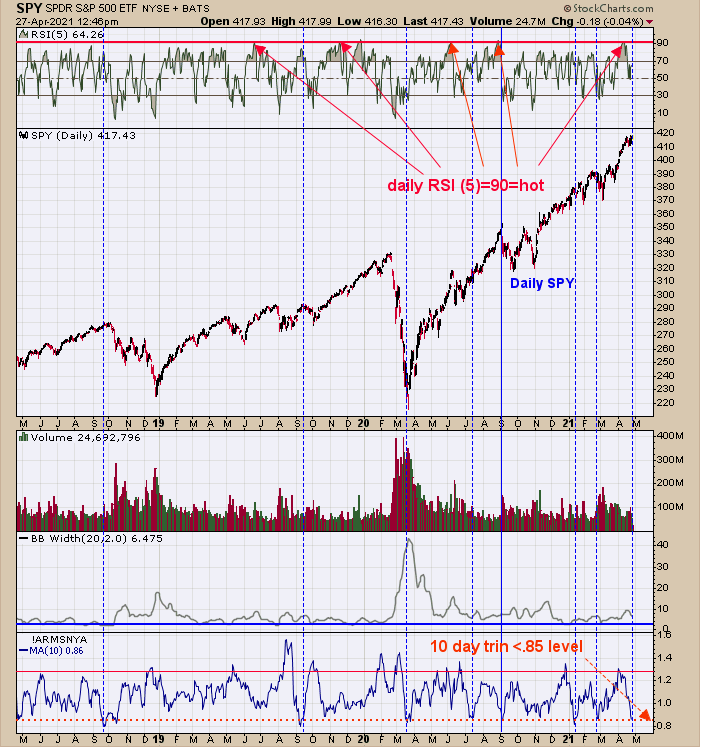
The bottom window is the 10 day average of the TRIN. Yesterday’s close came in at .86, at the bearish level where consolidation and decline can occur. A few days ago the RSI (5) for the SPDR® S&P 500 (NYSE:SPY) hit above 90 and also predicts the market may take a short term rest.
The bigger trend remains bullish, but over the next few days, the market may consolidate its gains from the previous weeks. Last Thursday a high volume day was recorded and the low of that day has not been tested and could be a downside target (the close came in around 411 on the SPY).
This week's performance may hold steady and next week could see the pull back. Staying patient for now.

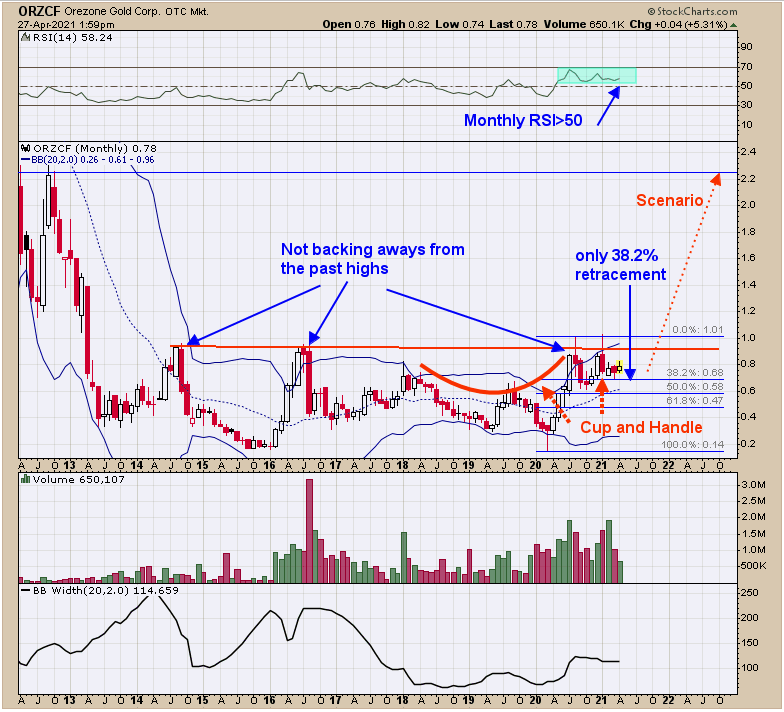
Above is the monthly Orezone Gold Corp (OTC:ORZCF) chart. There are several silver stocks that have the same setup chart pattern as Orezone, e.g., Hecla Mining Company (NYSE:HL), Endeavour Silver Corp. (NYSE:EXK), ISLVLF and SSVFF.
Notice that ORZCF is testing the previous high of 2016 and not backing away from that high suggesting its absorbing the supply. Since the last August high, ORZCF has been trading sideways and has only retraced 38.2% of its previous rally, which suggests this stock is in a strong position.
The pattern that appears to be forming is a Cup and Handle, with handle forming now.
Monthly RSI has been holding above 50 since March of last year and remains in bullish territory. It could reach near 2.00 or better on the next impulse rally.
I'm long GDX (10/9/20 at 40.78).
