S&P 500: Last Four Moves Made Elliott Wave Sense

Published 12/13/2019, 07:19 AM
Updated 07/09/2023, 06:31 AM
US500
-

What will the S&P 500 bring next week? That is the subject of discussion in our next premium analysis due out late Sunday!

Over a month ago, on November 8th, we published an article demonstrating the Elliott Wave principle‘s ability to predict relatively large moves in the S&P 500. As the move in question progressed we decided to take a closer look into its structure to see what is left of it.
S&P 500 - 30 Min Chart

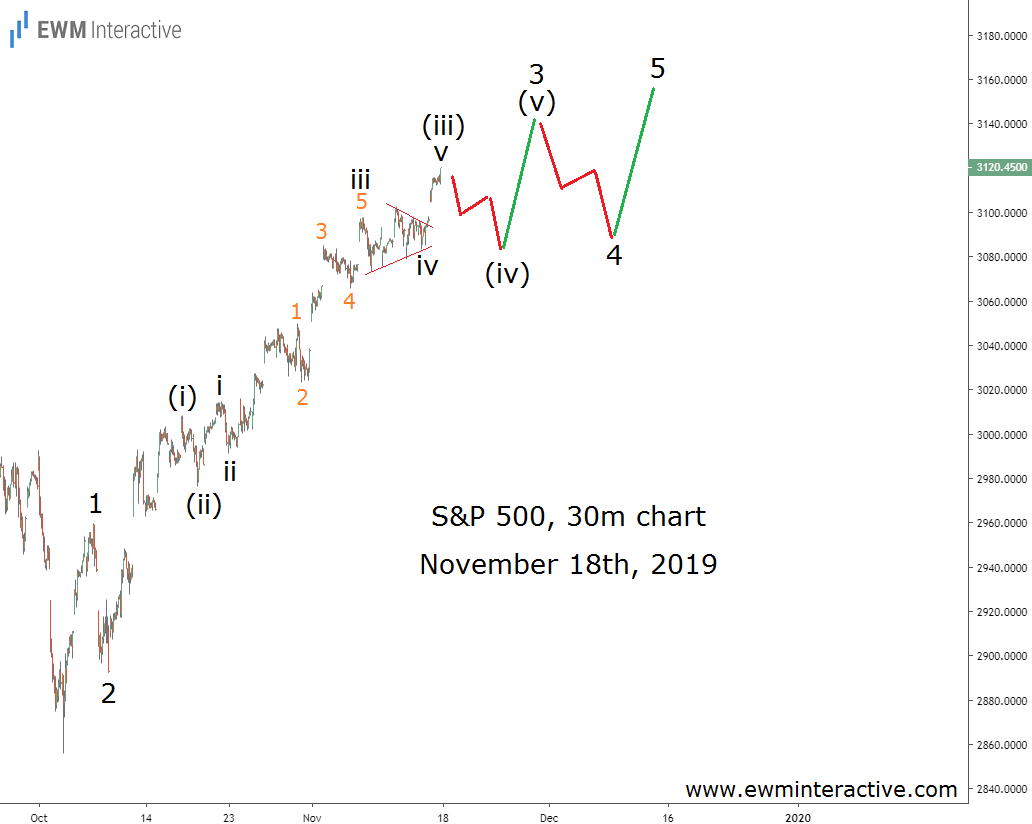
The chart below was part of the analysis our subscribers received on November 18th. In other words, before the latest trade talk developments, the UK election and the Fed interest rate decision. Yet, it turns out traders didn’t have to wait for all that news in order to make sense of the S&P 500.

Almost a month ago, the stock index was hovering around 3120 and was clearly in an uptrend. Trends tend to develop in five-wave patterns, called impulses. Hence, we thought one such impulse has been in progress since the bottom at 2856 in early-October. According to this idea, the S&P 500 had to make a couple of fourth and fifth waves before the pattern can be completed. Waves (iv) and (v) of 3, and waves 4 and 5 were still missing.

Elliott Wave Analysis Helps Predict Consecutive S&P 500 Moves

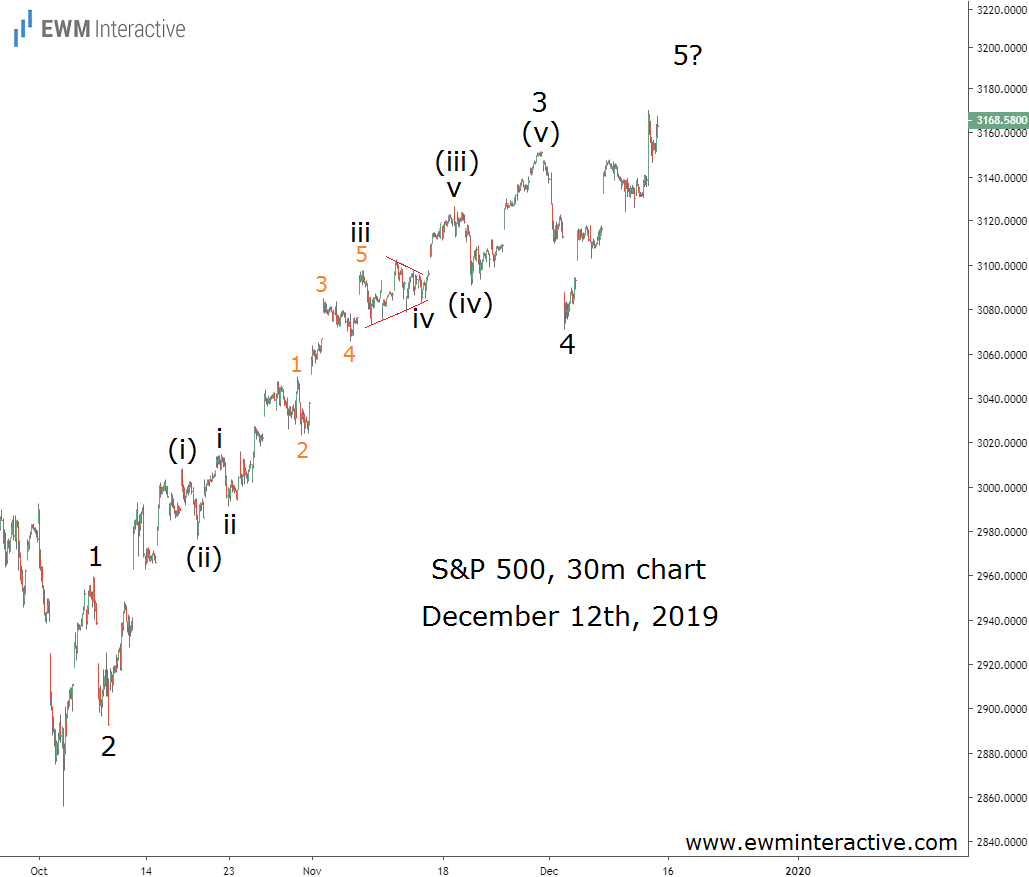
Fast-forward to December 12th, the U.S and China seem to have agreed on a tentative trade deal, Boris Johnson’s party won the UK election and the Fed kept interest rates unchanged. The S&P 500, by the way, developed exactly as planned.
S&P 500 - 30 Min Chart On 12th Dec

Wave (iv) was a small dip to 3091 on November 20th. Seven days later, on November 27th, the index made a new all-time high of 3154 in wave (v) of 3. Wave 4 was a sharp selloff to 3070 by December 3rd. Wave 5, which appears to be still unfolding, led the bulls to 3176 yesterday.

The future of the Brexit saga, the trade war and the Fed’ interest rate policy remain unpredictable. The patterns, however, are already giving us a hint about the S&P 500’s next step…

Original Post

Latest comments

Loading next article…
Risk Disclosure: Trading in financial instruments and/or cryptocurrencies involves high risks including the risk of losing some, or all, of your investment amount, and may not be suitable for all investors. Prices of cryptocurrencies are extremely volatile and may be affected by external factors such as financial, regulatory or political events. Trading on margin increases the financial risks.
Before deciding to trade in financial instrument or cryptocurrencies you should be fully informed of the risks and costs associated with trading the financial markets, carefully consider your investment objectives, level of experience, and risk appetite, and seek professional advice where needed.
Fusion Media would like to remind you that the data contained in this website is not necessarily real-time nor accurate. The data and prices on the website are not necessarily provided by any market or exchange, but may be provided by market makers, and so prices may not be accurate and may differ from the actual price at any given market, meaning prices are indicative and not appropriate for trading purposes. Fusion Media and any provider of the data contained in this website will not accept liability for any loss or damage as a result of your trading, or your reliance on the information contained within this website.
It is prohibited to use, store, reproduce, display, modify, transmit or distribute the data contained in this website without the explicit prior written permission of Fusion Media and/or the data provider. All intellectual property rights are reserved by the providers and/or the exchange providing the data contained in this website.
Fusion Media may be compensated by the advertisers that appear on the website, based on your interaction with the advertisements or advertisers.
© 2007-2025 - Fusion Media Limited. All Rights Reserved.