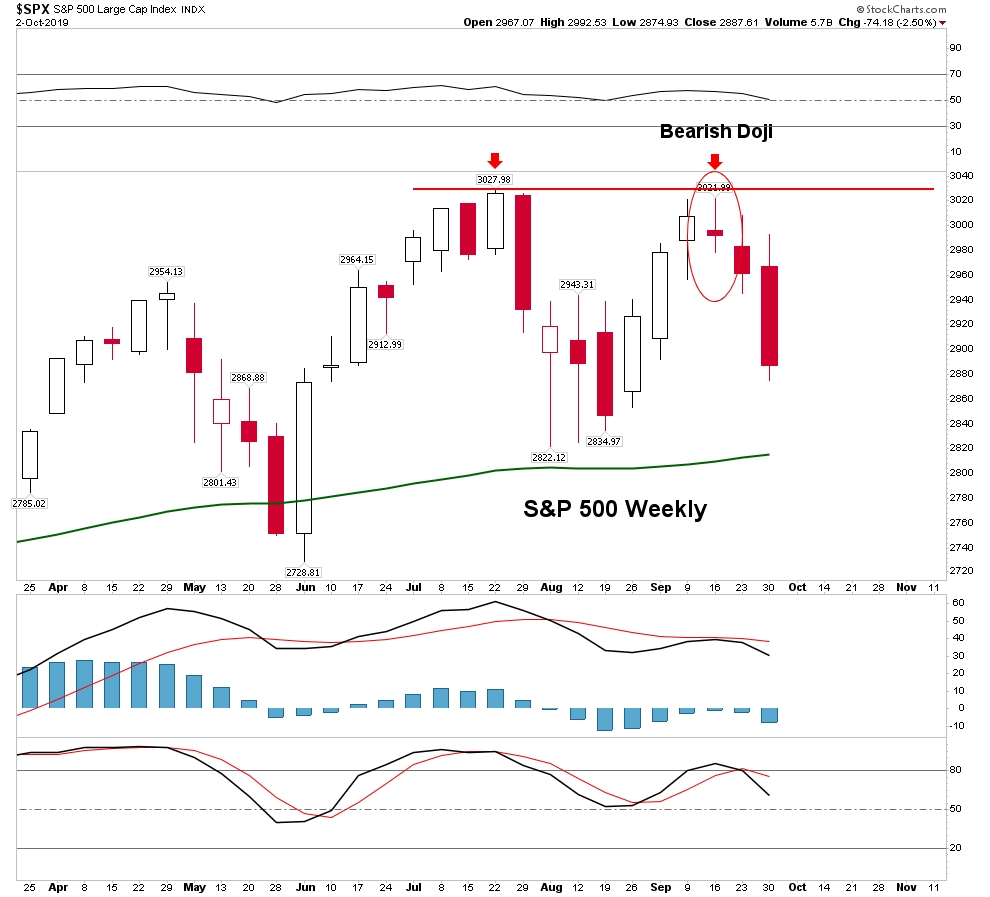
The S&P 500's recent rejection at the 2900-3000 area has formed two different technical patterns, a potential Broadening Formation or Reverse Triangle on the weekly chart (see chart below). Since January 2018, the S&P 500 has attempted to clear this 2900-3000 area multiple times and each time the test has failed and was followed by volatility and lower prices.
In January 2018, the S&P 500 rose to levels just under 2900 that was follow by a sharp selloff of 12.25 %. It later rebounded for several months to move slightly higher reaching 2941, but abruptly sold off once again. This time the decline took the S&P 500 down even further, beyond the lows that occurred at the beginning of the year. The S&P 500 plunged 20 % to the low in December of 2018. Prices bounced off the 200 week moving average near the 2350 area and formed a bottom.
That was followed by another attempt to test the 2900-3000 area of resistance on the S&P 500. The S&P 500 engaged in a powerful rally that took it right back up to the rising resistance trendline in the weekly timeframe and the 2900-3000 area once again.
Prices reversed at this area in late July 2019 and sold off around 200 points. Later, the S&P 500 bounced back to test the July high at 3028, only to set up a lower high at around 3022.
As this peak was forming on the weekly chart, sellers came in causing the S&P 500 to form a topping tail candlestick called a Gravestone Doji. This long upper shadow on the candle in September 2019 meant that sellers were lurking near the July high. It is a bearish reversal candle pattern that often forms at major turning points (see chart below).
The S&P 500 is now getting rejection at the 3000 area once again, opening the door for another violent selloff. The S&P 500 has formed a pattern of having powerful rallies to slightly new highs in the resistance area, whcih are followed by intense aggressive delcines to new lows.
If we connect the peaks and lows we see that we have either a Broadening Formation or a Reverse Triangle. In technical analysis a Broadening Formation is a topping process, whereas, a Reverse Triangle is a consolidation pattern in a larger bull market. Either way, it is probable that the recent peak in September 2019 on the S&P 500 will be followed by another violent selloff to a new low.
Should the trading range continue, our current selloff has the potiential to carry prices back to the lower trendline connecting the last two major lows. That opens the door for the S&P 500 to return to 2100 to 2200 area or around 28 % lower from the July 2019 high.
It we have a Reverse Triangle forming (which is a continuation pattern), then once it has completed the S&P 500 could successfully clear the 3000 area. A continuation pattern would allow the S&P 500 to continue to bull market for a little bit longer into year 2021 or so.

