A bullish run in stocks is on, driven by tech gains and value not yielding an inch. It is a rare constellation given the the long-dated Treasuries performance, especially – as if the narratives were flipped, and value could move up on rising yields.
Any way you look at it, the market breadth is positive and ready to support the coming upswing continuation, even though I look for a largely sideways day in stocks on Tuesday.
Both the VIX and put/call ratio are at extended levels. The first below 18 (formerly unimaginable to stock market non-bulls), the second approaching local lows again. As I have written yesterday:
(…) Throughout the markets, risk-on has been making a return as long-dated Treasury yields retreated, the dollar fell and commodities continue their bullish flag formation. It were the investment grade corporate bonds that signalled the turnaround in yields spreading to TLT next. Given such a constellation, the dollar's appeal is taking a dive as the bond market gets its reprieve. When nominal yields retreat while inflation (and inflation expectations) keep rising, real rates decline and that leads to dollar's decline.
It's the liquidity that has helped to erase quite steeper intraday decline in the long-dated Treasuries (iShares 20+ Year Treasury Bond ETF (NASDAQ:TLT) ETF) but the dollar took it on the chin.
Apart from oil, there have been quite a few commodity moves up yesterday – copper led the rebound out of its sideways pattern, lumber reached for new highs, agrifoods broke below consolidation lows. These are the pockets of strength as the $CRB index moved down yesterday.
It is not the case of precious metals. The rebound off the double bottom goes on, miners are in the pool position (senior ones, that is), and silver isn't reaching for the stars yet.
Let's move right into the charts (all courtesy of www.stockcharts.com).
S&P 500 Outlook

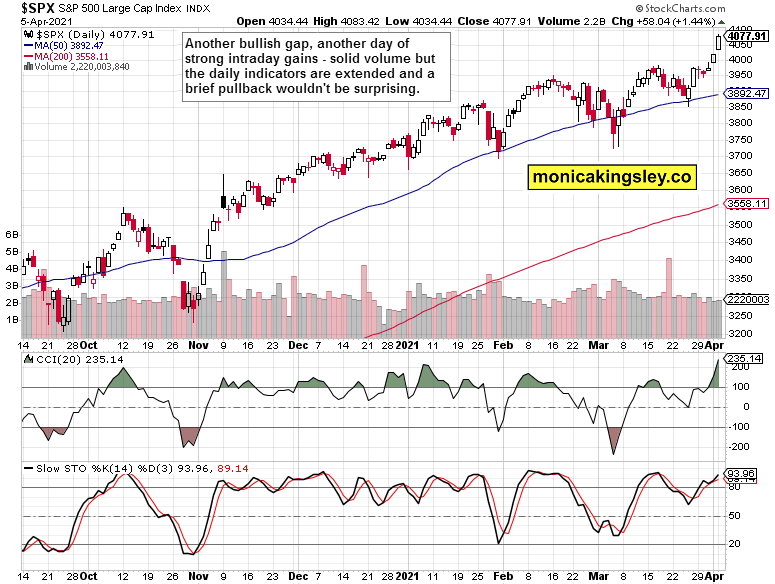
Quite an overshoot above the mid-February and mid-March highs, daily indicators are quite extended, and sideways trading today would be a bullish achievement. The upswing continuation isn't in jeopardy in the least though.
Credit Markets

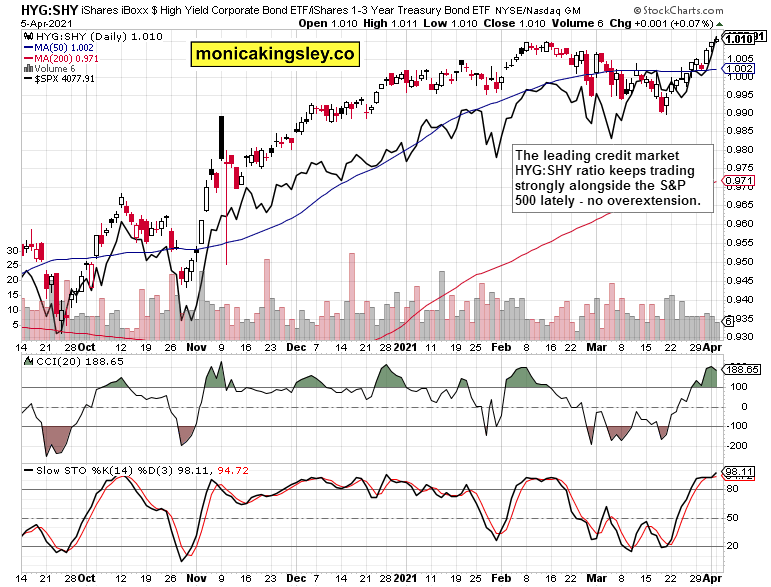
The high-yield corporate bonds to short-dated Treasuries (HYG:SHY) ratio is trading in lockstep with the stock market upswing, sending no warning signs.
Tech, Finance And Utilities

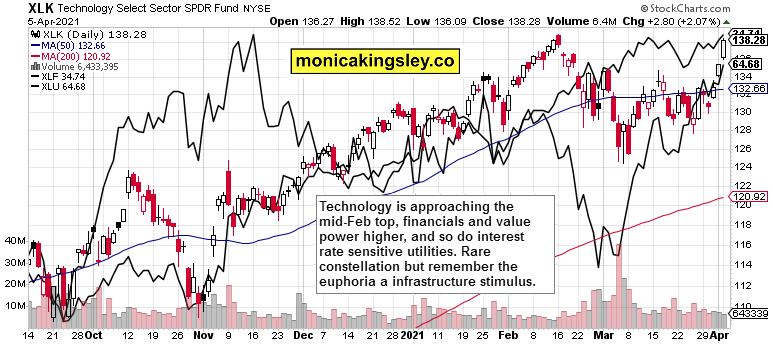
Tech (Technology Select Sector SPDR® Fund (NYSE:XLK) ETF) rose strongly, and financials (Financial Select Sector SPDR® Fund (NYSE:XLF)) as one of the value stocks (Vanguard Value Index Fund ETF Shares (NYSE:VTV) ETF) bellwethers moved higher regardless of the intraday turn in iShares 20+ Year Treasury Bond ETF (NASDAQ:TLT), which was, however, embraced by defensives, such as utilities (Utilities Select Sector SPDR® Fund (NYSE:XLU) ETF). Quite good market breadth still.
Summary
S&P 500 run above 4,070 is likely to be consolidated, but I'm not looking for a sharp correction starting here in the least. Tech could face short-term headwinds now given its upcoming resistance test, but that's about it.
Precious metals rebound goes on, with the miners still outperforming. Copper, though, appears pointing the way higher now too as the approaching upleg in commodities and precious metals in response to inflation running hotter and hotter, gains traction.
