Investing.com’s stocks of the week

What do you do when the S&P looks bad? You buy it, that’s what you’re supposed to do! Trading the S&P is a big game of ‘Tomfoolery’ these days. The first part of this is fading the gaps, and the second part is trying to stay with it.
Yesterday, I bought the S&P off the lows before the 8:30 open, it was the right trade, and I made money doing it. I figured everyone got short before the 8:30 open and that there would be a pop up, but after taking a small profit, what did I do? I sold it. When I told the PitBull what I did he said, “that’s what everyone does!” As we all know, when ‘everyone’ is doing the same thing, everyone gets smoked. I had it right, all I had to do was not try and be smart, just sit back and let the ES run, but I couldn’t, and I turned a profitable day into a losing day.
S&P Making Bad News Into Good
After making a high at 2584.75, up +5.25 handles, on Globex the ES then sold sold off down to 2570.25, down -9.25 handles. The futures were pointing to a 0.25% opening loss as investors appeared increasingly concerned over the U.S. tax-overhaul plan. The Stoxx Europe 600 was down 0.80%, its fifth consecutive session of declines, led by losses in financial services and mining. Asian markets closed broadly lower, and the British pound slipped on a potential leadership challenge in Parliament. The day had all the earmarks of something bad, but as I have always said, ‘the S&P tends to make good out of bad news,’ and that’s exactly what it did.
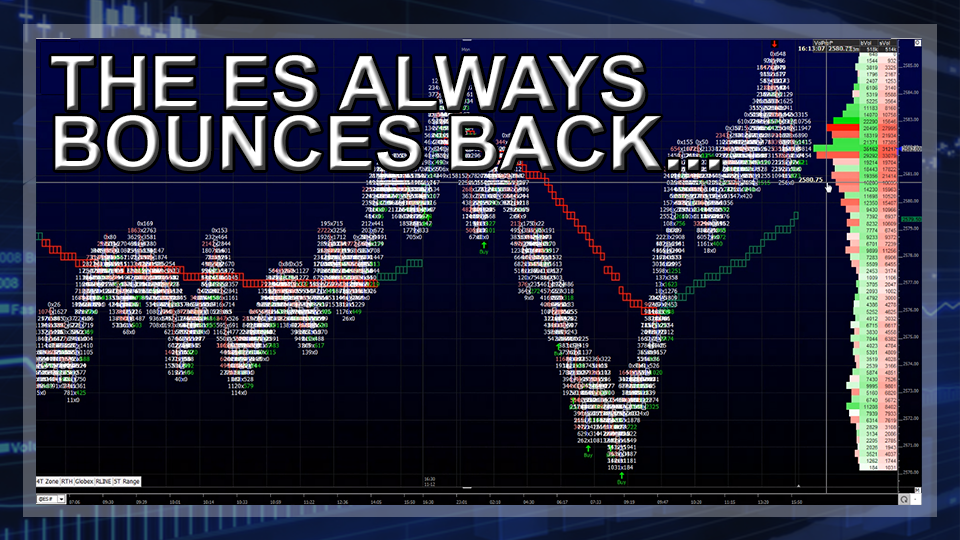
On the 8:30 CT futures open, the ES down ticked to 2572.25 and then went straight up to 2582.25, a 10 handle bump in the first 45 minutes. From there, the futures pulled back down to 2578.25 before ‘back and filling’ up to 2583.25 just before 12:30 CT. After that, the ES pulled back to 2589.25 and then rallied up to 2584.00, 2 ticks shy of the 2584.50 overnight Globex high. The next uptick pushed the ES up to 2585.50 at 2:30 CT. Just after printing the high, the MiM went from $632 million to sell up to $855 million to sell, and the ES quickly sold off down to 2580.75 before one final pop up to 2583.25.
Despite the late down tick, the ES showed how resilient it is. In the end the S&P 500 futures (ESZ17:CME) settled at 2582.00, up +2.50 handles, or +0.09%; the Dow Jones futures (YMZ17:CBT) settled at 23,406, up +24 points, or +0.10%; the Nasdaq 100 futures (NQZ17:CME) settled at 6312.00, up +2.75 points, or +0.04%; and the Russell 2000 (RTYZ17:CME) settled at 1172.50, up +1.00 points or +0.08% on the day.
