We have our first snow here in Northeast Ohio today. The weather has definitely changed. It has been very cold all week. I know this because I can see the snow and feel the chill when I am outside. But observing the conditions of the stock market are not as easy. There are many opinions to sift through, some informed and others just loud.
So when I look at the market I try to look at the one truth: price. Price can tell a lot as it reflects the current consensus of all market views. How price action gets filtered is how we are influenced and biased into particular views. So today I want to present several items around price without any filter. Here is the data set for you to make your own assessment.
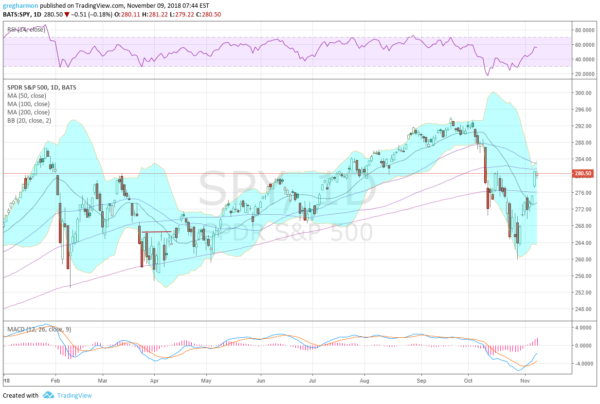
The S&P 500 is up nearly 8% from its October 29th low.
The October 29th low was a higher low following a higher high on weekly and monthly charts.
The S&P 500 is back over its 200 day SMA.
The S&P 500 closed over its October 16th bounce making a higher high.
Deep levels of the MACD (momentum) have reversed and it is rising.
RSI (also momentum) made a higher low on October 29th and is now near the bullish zone.
The Bollinger Bands® are opening as price rises to the top of them.
The information in this blog post represents my own opinions and does not contain a recommendation for any particular security or investment. I or my affiliates may hold positions or other interests in securities mentioned in the Blog, please see my Disclaimer page for my full disclaimer.

