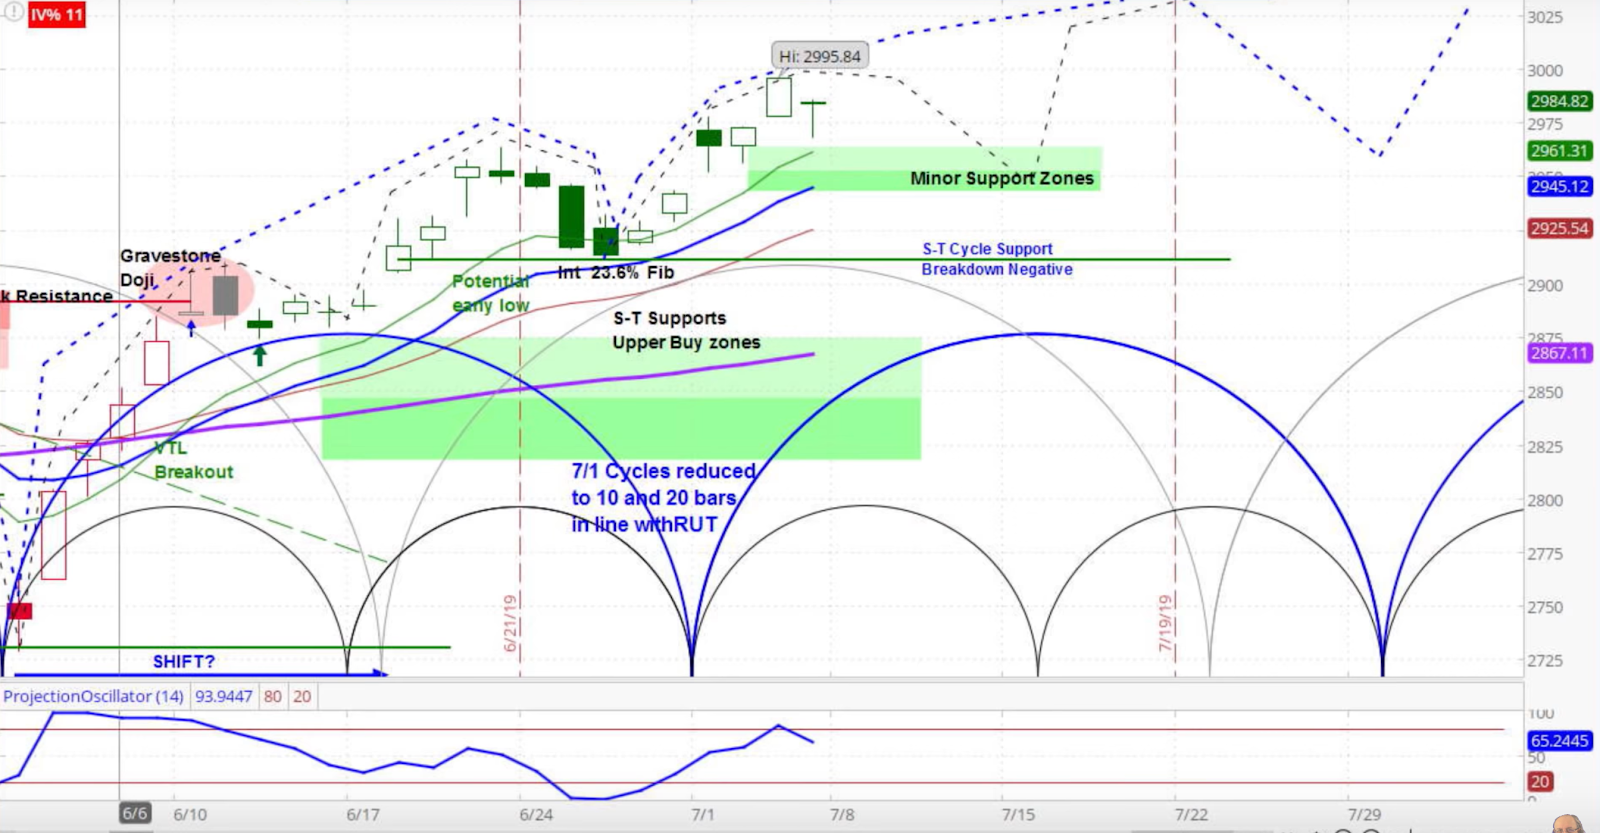
Summary:- The S&P 500 (SPX) rose 58 points last week to 2990, an increase of 2%.
- However, global economic data continues to show signs of weakness.
- Our projection this week is for the SPX to decline as the current minor cycle corrects.
The stock market last week continued its rise to previously unknown levels, with investors buying into the July 4th holiday albeit in relatively low volume, as I pointed out in the latest Market Week show. Yet this occurred while the global economy pointed to a slowdown, as purchasing managers indexes (PMI) in the US and around the world missed expectations. Ironically, the market was disappointed when US nonfarm payrolls exceeded the average forecast by so much that hopes for the Fed rate cut were temporarily dashed.
S&P 500 (SPX) Daily Chart
Turning to the first chart, our approach to technical analysis uses market cycles to project price action. Our analysis is for the S&P 500 to pause for the latter half of the current minor cycle, before resuming its move higher. Our support zone is 2945-2965, with an upside target of 3032.
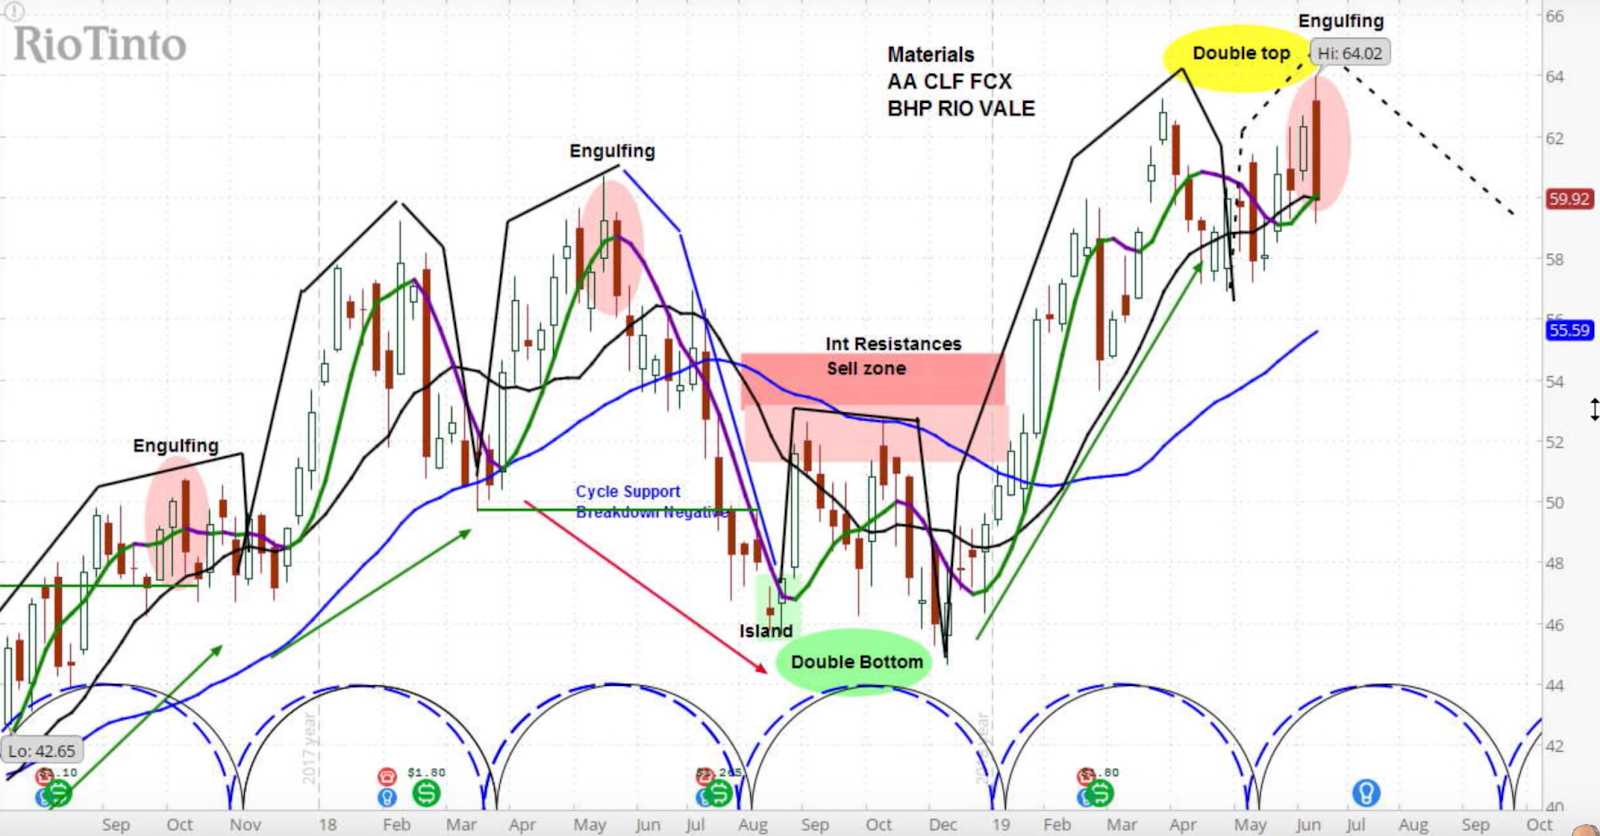
Amongst the individual stocks that moved significantly last week was mining company Rio Tinto (LON:RIO). This stock fell 5% on Friday after it was reported that the Chinese government was considering taking action over high iron ore prices.
Rio TInto (RIO) Stock Weekly Chart
RIO is correlated with the Base Metals Index ETF (NYSE:DBB), whose market cycles are represented by the dashed blue cycles brackets at the bottom of the chart above.
We believe that RIO has now completed the rising phase for its current cycle, with this week’s move effectively producing a double top. As our projections and the cycle brackets show, there is plenty of time left in this cycle to decline into the middle of September.
For more from Slim, or to learn about cycle analysis, check out the askSlim Market Week show every Friday on our YouTube channel.


