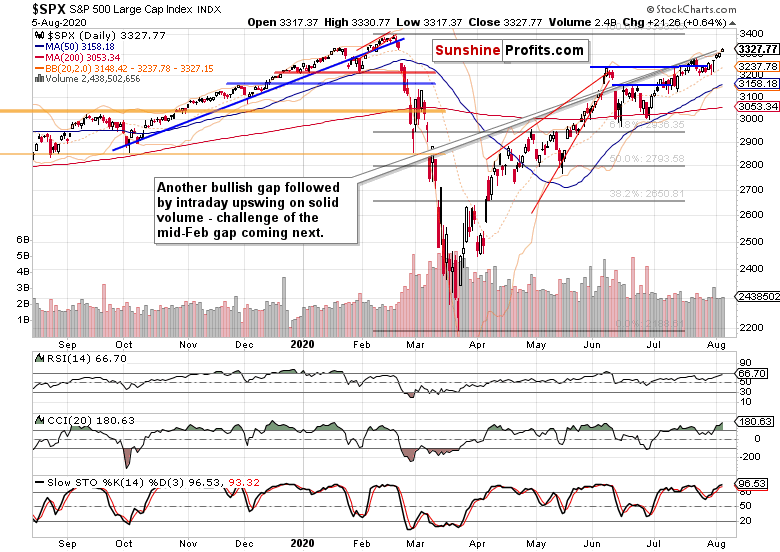
After another bullish gap and more intraday gains, stocks are likely to challenge the mid-Feb gap's upper border at around 3335 shortly. And once they succeed, the Feb all-time highs come next. And frankly, why shouldn't they make it there before the elections uncertainty fully strikes?
Protracted stimulus negotiations (let alone a botched deal falling too short of the markets' expectations), now that would have some power to rock the bullish boat. Talking spanners in the works, here come the jobs data. Yesterday's ADP non-farm employment change fell way short of expectations, but today's new and continuing unemployment claims showed improvement.
I expect not too exciting non-farm employment change figures tomorrow, underscoring the pain the real economy feels and its tenuous path to recovery. It was encouraging to see the bulls waving off bad data this fast yesterday. No knee-jerk reaction, which means the markets aren't willing to take that seriously just yet (are they betting this soft patch would be gone?).
With U.S.-China tensions on the back burner, stimulus takes the spotlight – with a flare up in earnest between the frenemies (think trade deal phase one) being the wildcard (distant black swan). After a two-week window of the Fed expanding its balance sheet, the central bank tightened again as the data for the final July week show.
So, will the stimulus with its bone of contention in the form of federal $200 or $600 addition to unemployment claims be a buy-the-rumor-sell-the-news moment?
In my opinion, the markets are more likely to welcome it than to sell off in its wake.
This isn't all out greed, and the retail investors aren't yet largely in. This bull run is even more hated and disbelieved that the one in 2009. I know, I have been trading those days too, and have a lot to compare against – this is not the dot-com mania or housing bubble level of greed. Far from it, and whoever brings up the bubble talk – remember that bubbles first need to get ridiculous before they burst. In this unprecedented reflation, we aren't there yet.
But first things first. The jobs-heavy week with a seventh profitable trade in a row just closed, brought up these trades' total to 244 points gained!
Let's check the market pulse next.
S&P 500 In The Short-Run
I’ll start with the daily chart perspective (charts courtesy of http://stockcharts.com ):

This breakout attempt above the early June highs is really sticking, and has powered higher on solid volume yesterday. With sellers nowhere to be seen, both the Monday and Wednesday bullish gaps are standing and supporting the bulls.
Let's check the credit markets next.
The Credit Markets’ Point Of View
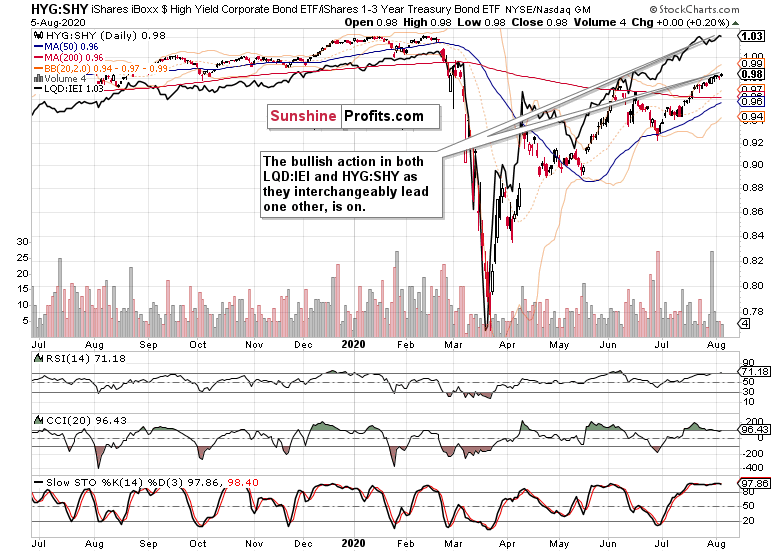
High yield corporate bonds (HYG ETF (NYSE:HYG)) moved higher, ever so lightly but still (please see this and many more charts at my home site). The volume decreased though, which could mark a
short-term indecision ahead.

Regarding these two ratios, my credit market observations from yesterday are relevant also today:
What a great sight as both leading credit market ratios – high-yield corporate bonds to short-term Treasuries (HYG:SHY) and investment grade corporate bonds to longer-dated Treasuries (LQD:IEI) – are supporting each other's upswings. One day the former has the baton, the next day the other leads. The direction is clear, enabling higher stock prices.

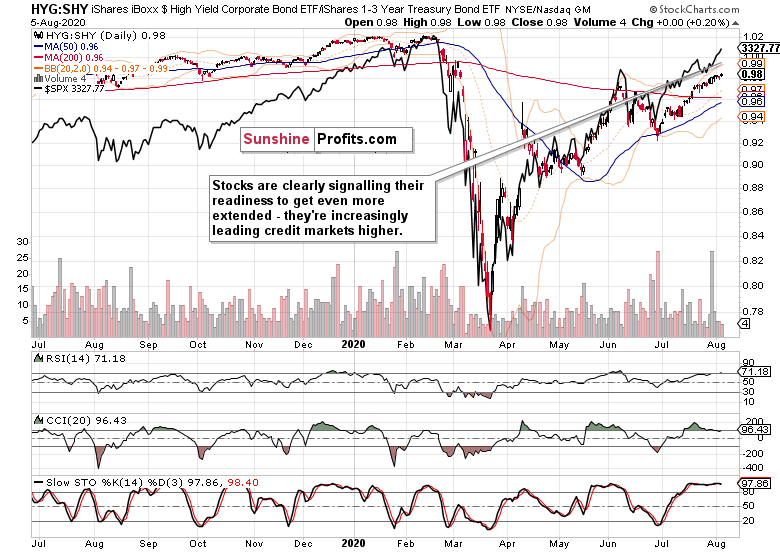
The overlaid S&P 500 closing prices (black line) keep getting farther away from the HYG:SHY ratio. They indeed seem more than willing to lead, thus sending a message of the bull run having still a way to go.
The notes below about this bull run are still ringing true today:
So far, the propping efforts to bridge the mini-depression are working. The recovery off the March lows has been among the strongest ones when looking at all the WWII stock market rebounds that have made it past the 61.8% Fibonacci retracement. We're still in the "everyone benefits and no one pays" stages of inflation. The canaries in the coal mine flashing danger (hey, this can't last forever) are gold and the dollar.
Small Caps, Emerging Markets And Copper
The S&P 500 closing prices overlaid with the Russell 2000 (IWM ETF (NYSE:IWM) paints a bullish picture – small caps sprang to life, and on respectable volume. That's good for both indices.
Emerging markets (EEM ETF (NYSE:EEM)) are alive and well too, as their overlaid black line shows. That's another piece in the bullish S&P 500 puzzle – with higher highs and higher lows the
norm these weeks, the S&P 500 path of least resistance remains up.

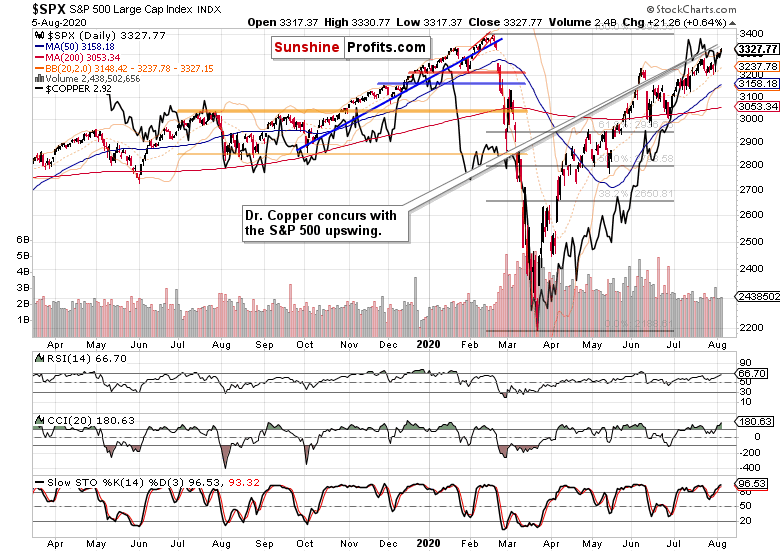
The red metal (copper) agrees with stock market bulls. Consolidating the earlier July gains, it's getting ready to move some more, or consolidate gains as a minimum. The prevailing direction is higher for both this metal with a PhD in economics, and the stock market itself.
Summary: Summing up, the preceding S&P 500 consolidation paved the way for more stock gains, and it wasn't all due to tech pushing higher again. The advance-decline line is subtly improving, and has further to run. With credit markets, small caps and emerging markets aligned, the bulls are well positioned to grapple with incoming jobs market data, and welcome the stimulus cheerfully.
