
We primarily track the S&P 500 (SPX) using the Elliott Wave Principle (EWP). In our last update (see here) we viewed the current rally from the May 31 $5191 low as an impulse 5th wave targeting ideally $5427-53, based on a standard Fibonacci-based impulse pattern.
See Figure 1 below:
Figure 1. Hourly SPX chart with detailed EWP count and technical indicators
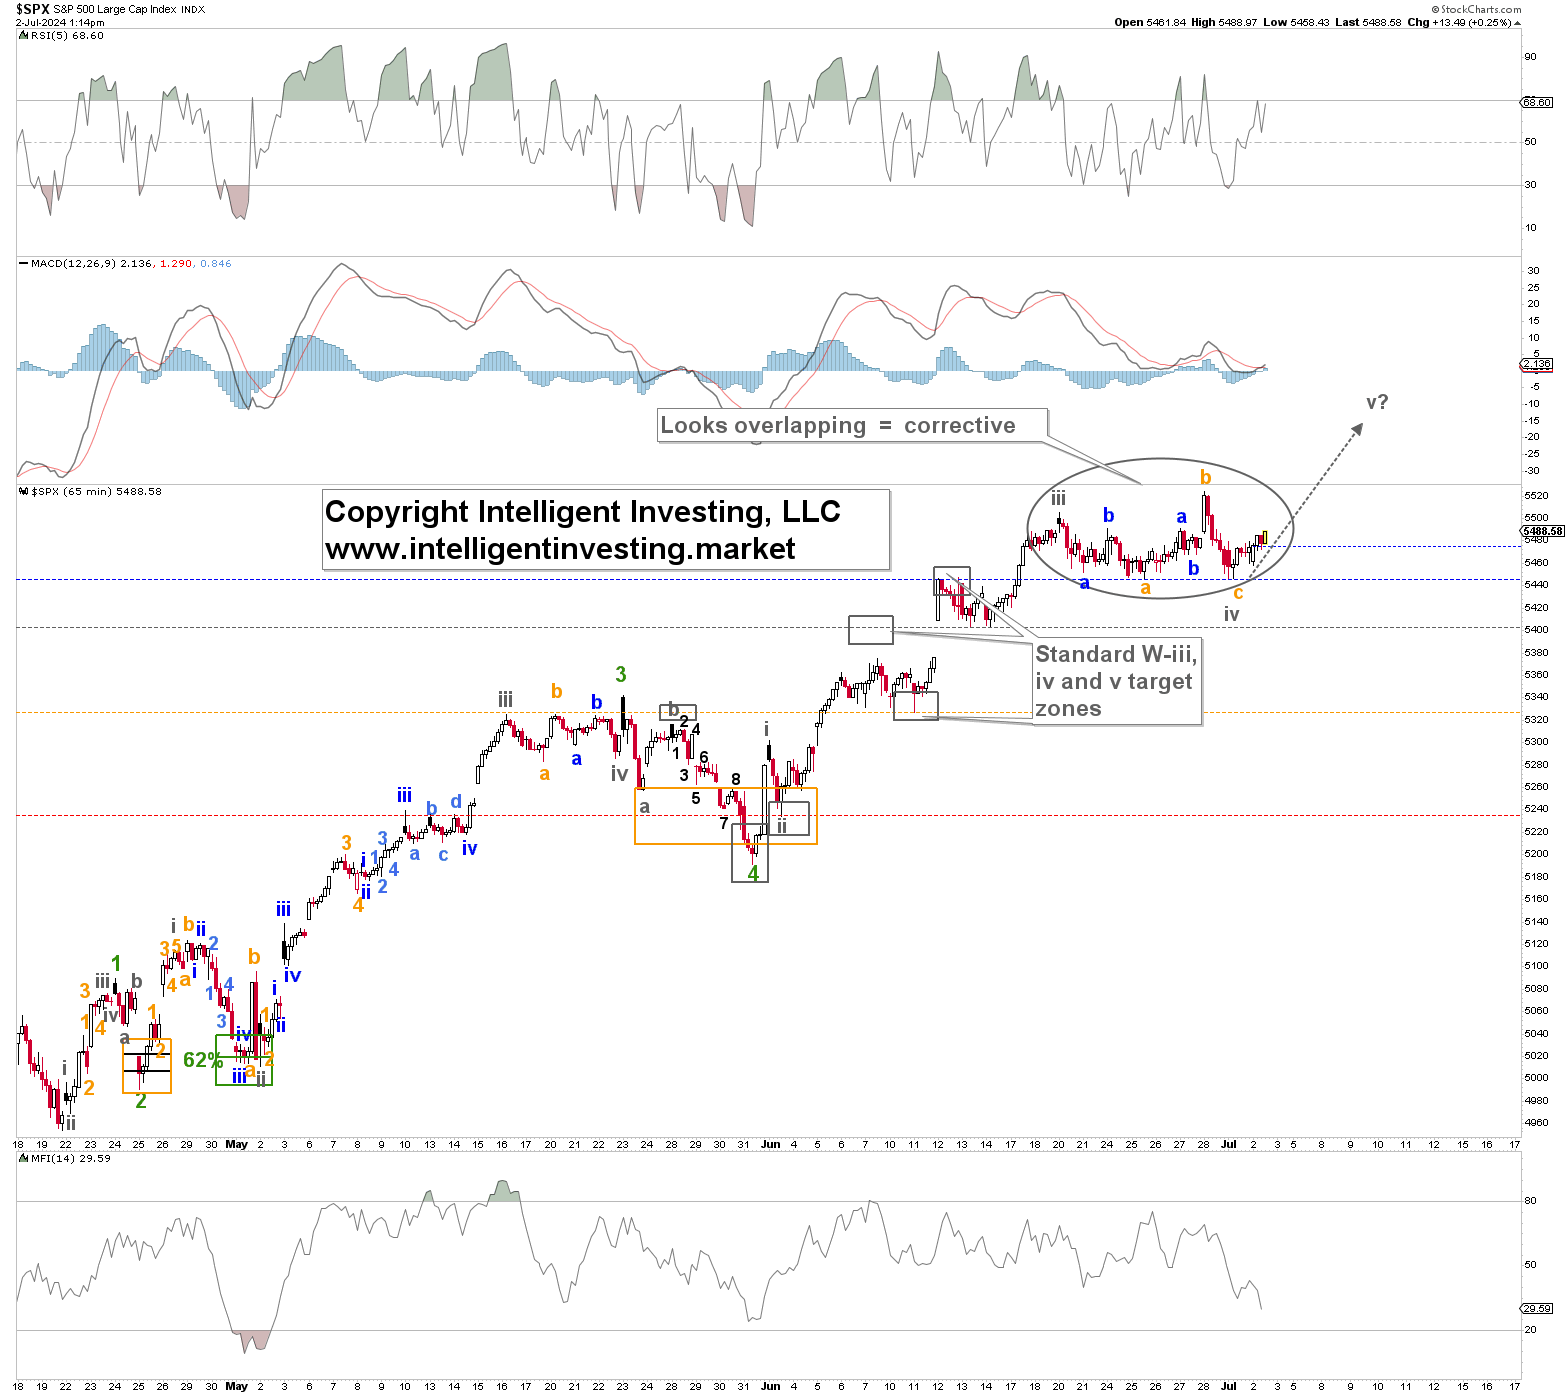
However, the index extended beyond the standard Fib-based pattern and has essentially gone sideways for the past eleven trading days. Thus, as stated in our previous update
“Namely, the rally from the April 19 $4953 low could see one more W-4, 5 sequence. Instead of a ~10% correction from the ideal $5427-53 target zone, we could only be treated with a single-digit pullback to around $5260+/-15 for the potential W-4, followed by a last W-5 to ~$5550+/-25. It will require a drop below last week’s low from the ideal $5427-53 target zone to strongly suggest a deeper correction is underway.”
Figure 1 has colored dotted horizontal lines at key price levels, which are warning levels for the Bulls. Blue is the Bulls’ 1st warning, grey the 2nd, etc., and if the index drops below them, it increases the odds that the upside target will not be reached. Hence, they can be used as stop (loss) levels. Thus, as the rally extended, we raised those levels. The index will have to drop below $5325, the orange warning level, to strongly suggest a larger correction is underway.
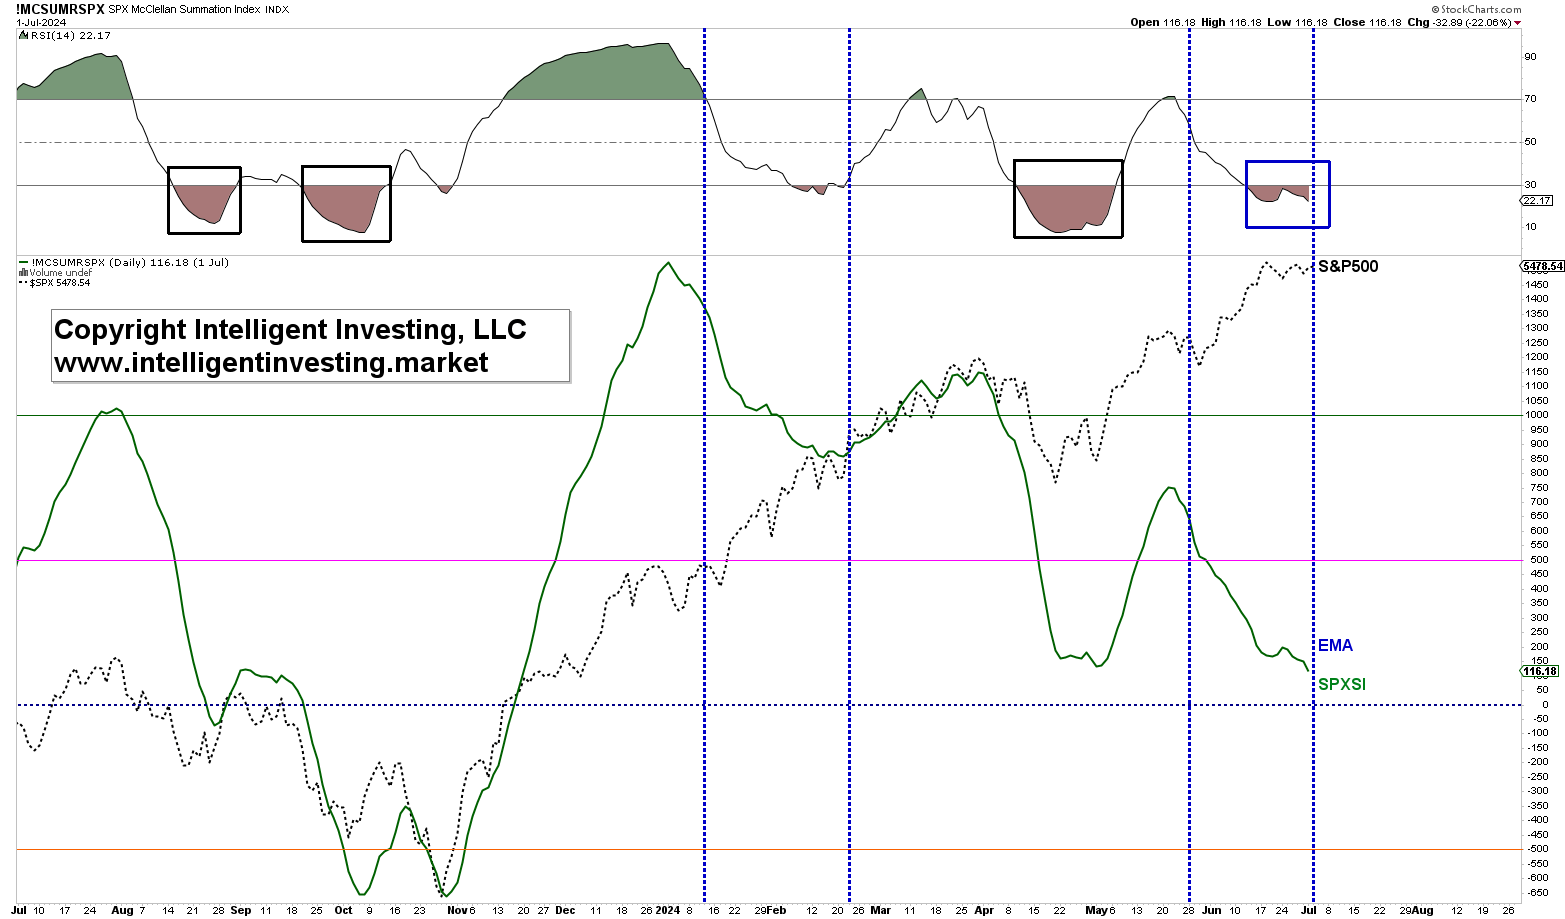
Moreover, the daily McClellan Summation Index (SPXSI), a market breadth indicator, is already getting oversold (see Figure 2 below), which suggests the path of least resistance is back up. That means improving breadth, which tends to equate to higher index prices. So far, the SPX has “suffered” a stealth correction: moving higher on decreasing breadth, as it did earlier this year (blue dotted lines). The former case was resolved higher.
Figure 2. Daily Summation Index for the SPX
Lastly, we can look at seasonality. Here, we assess only the average path the index has taken during the US Presidential Election Years (see Figure 3 below). It follows that, on average, an important low is struck in late June, July sees more of a consolidation, and August will be the real deal.
Figure 3. Average Seasonality in an Election Year for the SPX.
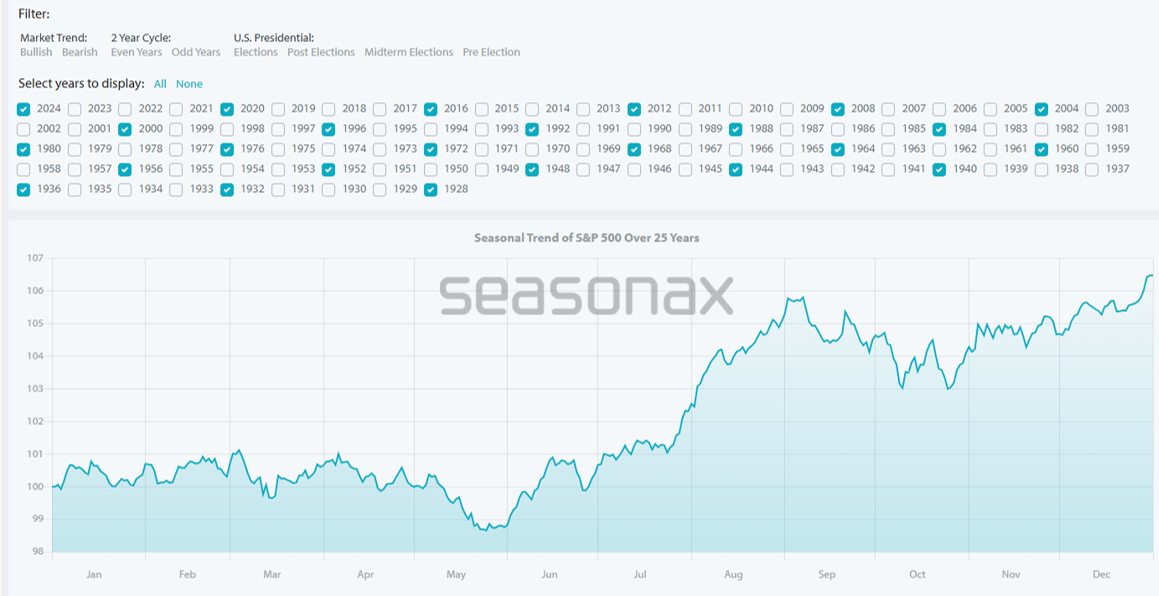
However, we must be cognizant of the fact that this is an average and thus not set in stone. It’s a great potential road map we can track. When the market deviates from it, we should no longer rely on it. However, for now, it is working as the SPX bottomed last week.
In conclusion, although some charts suggest we should look higher, price is always the final arbiter. However, the Bears have so far been unable to break price below even the 1st raised warning level, and if the index can stay above $5400, and especially $5325, we see no reason to turn Bearish.