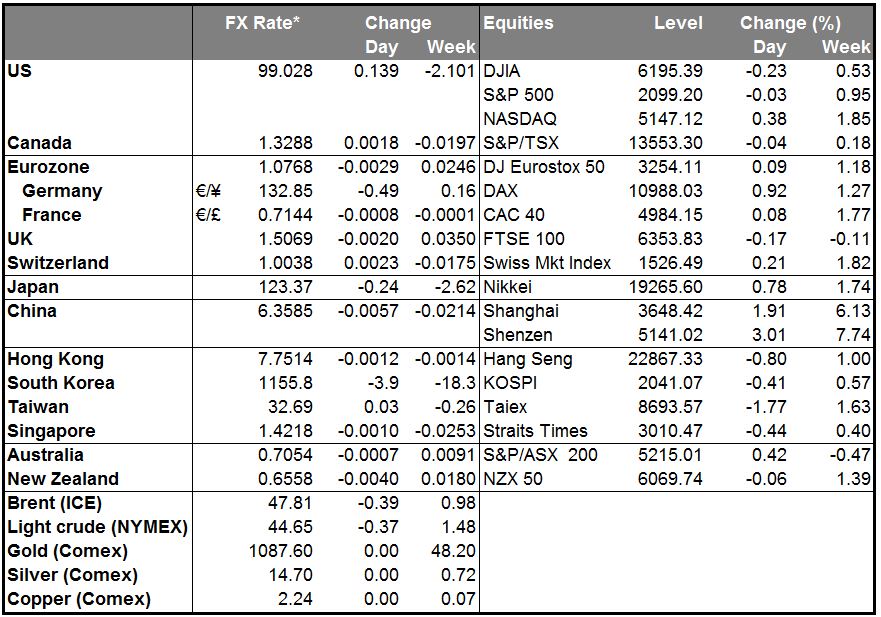
• Solid US jobs report boosts the case for a December rate hike The US economy added an astonishing 271k jobs in October, far exceeding expectations of 180k and much better than the last two months sluggish gains. The unemployment rate also fell to 5.0% from 5.1%, while average hourly earnings accelerated from the previous month. The solid jobs report offset the soft readings in the prior two month, and raised the likelihood for the Fed to pull the trigger on an interest rate hike at its final meeting in December. The market is currently pricing a 70% chance of a hike in December, up from around 60% a day before the release of the employment report. The greenback rallied to a near 7-month high against a basket of currencies, and could remain supported as US data continue to bolster the case for a rate hike this year.
• Today’s highlights: The economic calendar is relatively light. We start the day with Germany’s trade balance for September. Both exports and imports are forecast to have risen after declining in August. Exports are expected to have risen at a faster pace than imports, something that would drive the nation’s trade surplus up for the good reasons. We stay a bit cautious on this expectations as the Volkswagen (DE:VOWG) scandal may have hurt the country’s exports.
• In the US, the Labor Market Conditions Index (LMCI) for October is to be released. Although this indicator is not a major market mover, we will watch it closely due to the Fed’s emphasis on the employment data. Following the astonishing surge in nonfarm payrolls on Friday, and a strong overall employment report, another upbeat labor indicator could increase the probabilities for a Fed hike in December.
• Canada’s housing starts for October are also to be released.
• We have only one speaker on Monday: Boston Fed President Eric Rosengren.
• As for the rest of the week, on Tuesday, we get China’s CPI and PPI data for October. The CPI is expected to have slowed to 1.5% yoy from 1.6% yoy, while the PPI is forecast to have declined at a bit slower pace than in September. The CPI rate is well below the PBOC’s target and this leaves the door open for further monetary easing if necessary. We believe that the Bank is likely to cut the reserve requirement on more time this year.
• We also get the CPI data from Norway. Norway’s inflation rate is expected to have risen to 2.2% in October from 2.1% previously. In its latest policy meeting, the Norges Bank decided to leave its benchmark interest rate unchanged and noted that the weaker-than-projected NOK, along with a more expansionary fiscal policy, contributed to fueling demand for goods and services. An increase in Norway’s inflation rate is likely to increase speculation that the Bank will stand pat at its next meeting as well. This could prove NOK-positive.
• On Wednesday, the highlight of the day will be the UK employment report for September. The forecast is for the unemployment rate to have remained unchanged at 5.4%, while average weekly earnings are expected to have accelerated to 3.1% yoy from 2.9% yoy. Further improvement in the UK job market is likely to support cable, which could erase some of its losses caused by the BoE dovish stance last Thursday and the strong US employment report on Friday.
• On Thursday, during the Asian morning, Australia’s employment report for October is coming out. The unemployment rate is forecast to have remained unchanged at 6.2%, while the net change in employment is expected to show an increase of 15k, after a decline of 5k in September. This will confirm the upbeat view of the RBA on the country’s labour sector, something that we saw in the Bank’s Statement on Monetary Policy last week. Improvement in Australia’s employment could strengthen AUD, especially against NZD.
• During the European day, we get Sweden’s CPI and CPIF for October. The headline inflation rate is forecast to have remained unchanged at 0.1% yoy, while the CPIF rate is expected to have risen by a percentage point. At its latest policy meeting, the Riksbank noted that economic activity in Sweden is strengthening and inflation is showing a clear upward trend. The CPIF data seem to be in line with that view, but bearing in mind that the Bank is very concerned regarding the strength of the global economy and that the ECB looks ready to pull the trigger for further stimulus, we believe that these data will not be enough to ease the pressure from the Riksbank to act again in the foreseeable future. We maintain our SEK bearish view.
• Finally on Friday, we get the preliminary GDP data for Q3 from France, Germany, and Eurozone as a whole. Eurozone’s preliminary GDP is expected to have risen at the same pace as in Q2, while figures released from Germany, Eurozone’s growth engine, are likely to show that the German economy has slowed in Q3. Investors will most likely watch the French, Italian and German data released ahead of the bloc’s figure for the overall growth outlook of Eurozone and EUR will react accordingly.
• In the US, headline retail sales are expected to have accelerated in October, while retail sales excluding autos and gasoline are estimated to have risen after staying unchanged in September. Further improvement in retail sales could suggest a pick-up in growth for Q4 and could strengthen the greenback further.
The Market
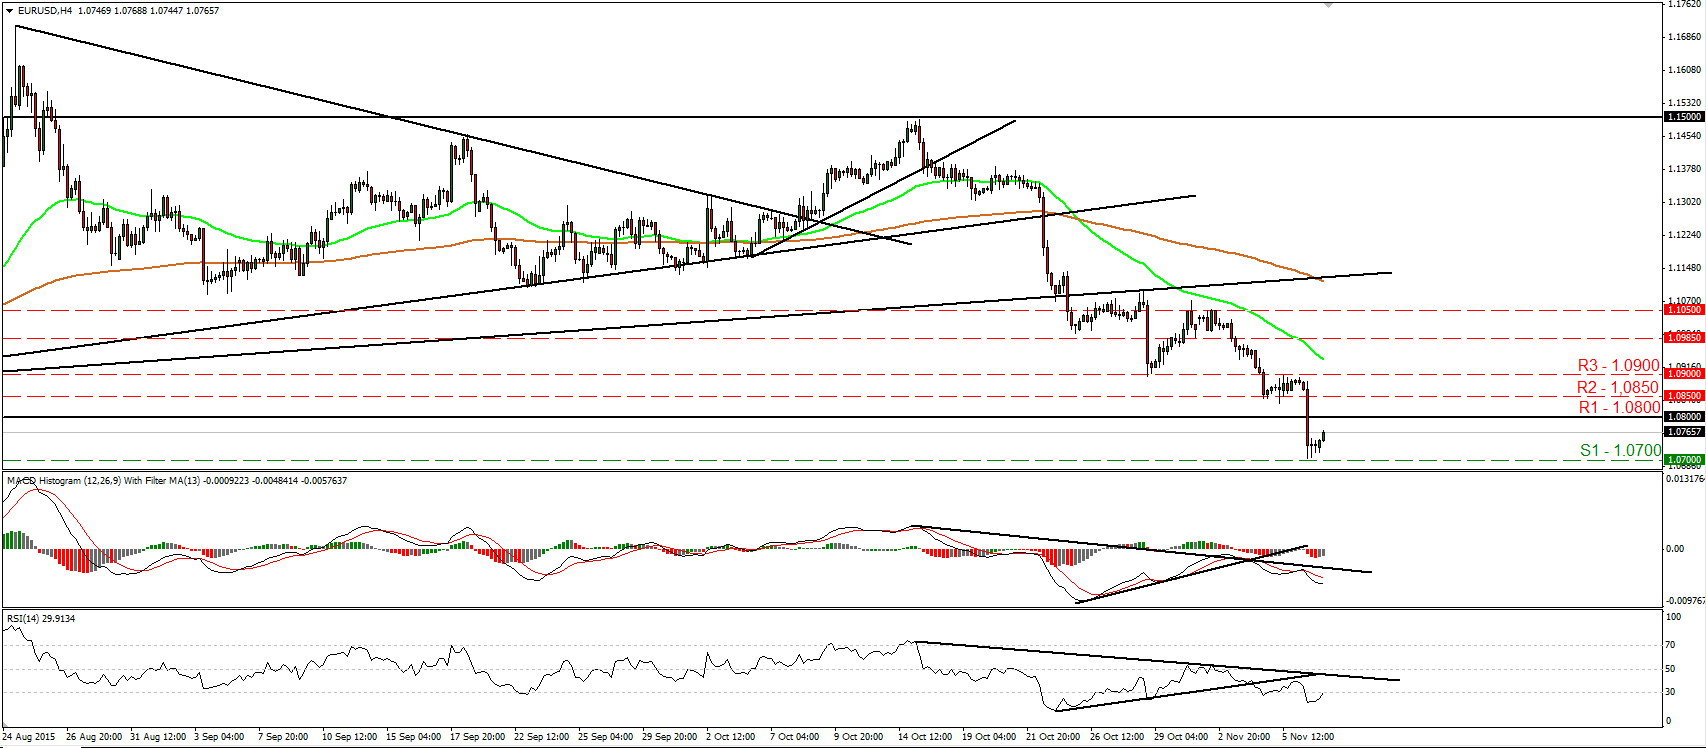
EUR/USD breaks below 1.0800 on strong US job data
• EUR/USD plunged on Friday after the US employment report showed that nonfarm payrolls surged by 271k in October, bolstering the case for a Fed hike in December. The pair fell below 1.0850 (R2) and managed to overcome the key support zone of 1.0800 (R1). The decline was stopped fractionally above the 1.0700 (S1) and then the pair rebounded. On the 4-hour chart, the short-term picture remains negative and as a result, I would expect a clear dip below 1.0700 (S1) to pave the way for our next support of 1.0660 (S2). Taking a look at our short-term oscillators though, I see signs that the current corrective bounce may continue for a while before the next negative leg, perhaps to challenge the 1.0800 (R1) barrier as a resistance this time. The RSI has bottomed within its oversold zone and now looks ready to move above 30, while the MACD, although negative, shows signs of bottoming and could move above its trigger line soon. In the bigger picture, the break below the key support area of 1.0800 (R1) signaled the downside exit from the sideways range the pair had been trading since the last days of April. In my view, this has turned the longer-term outlook negative as well. • Support: 1.0700 (S1), 1.0660 (S2), 1.0625 (S3) • Resistance: 1.0800 (R1), 1.0850 (R2), 1.0900 (R3)
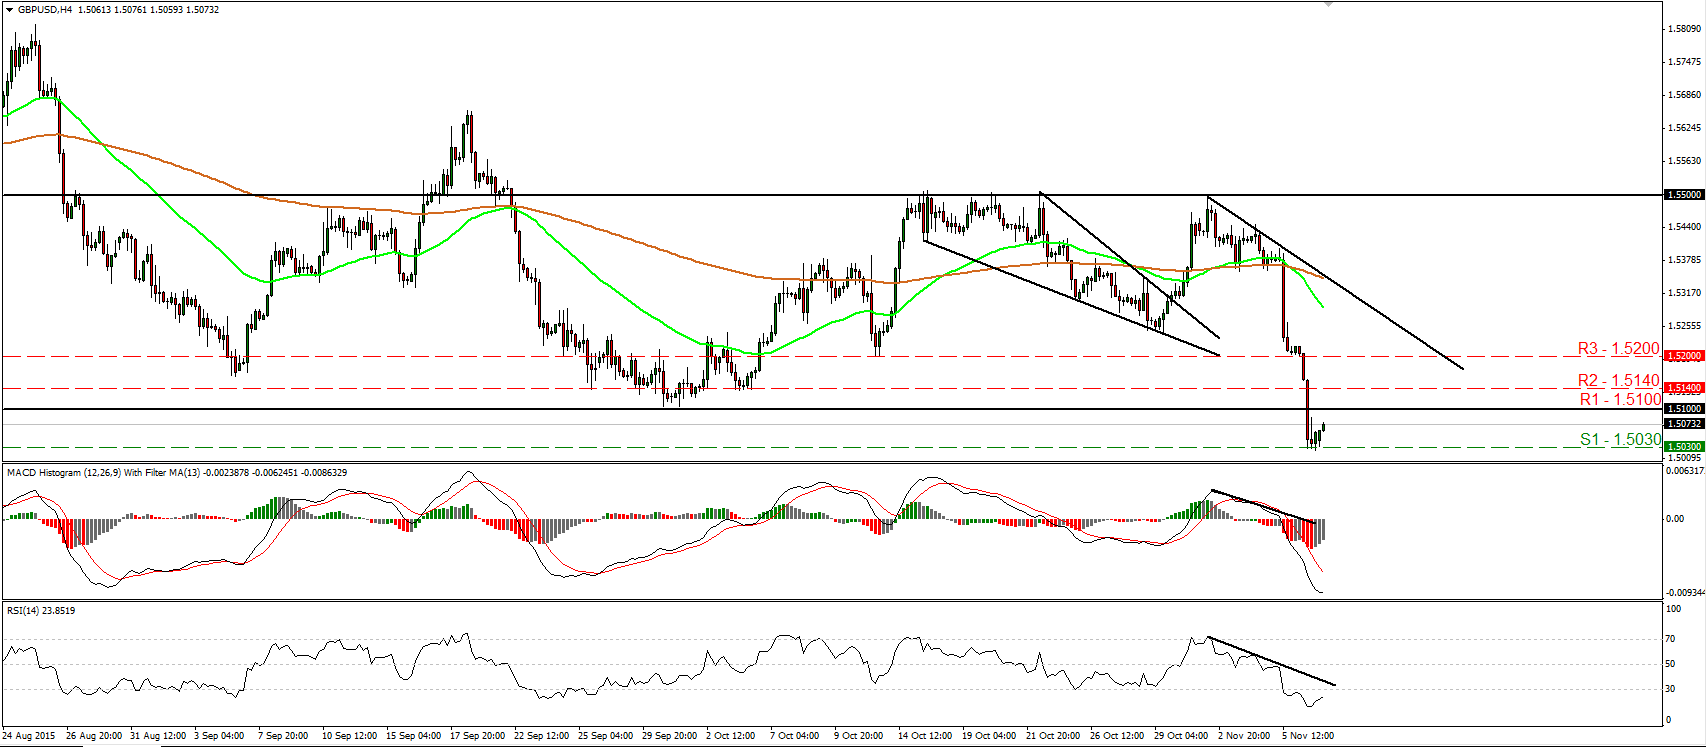
GBP/USD could challenge 1.5000 very soon
• GBP/USD plunged on Friday following the solid US NFP print, falling below the key support (now turned into resistance) zone of 1.5100 (R1) and hitting support near 1.5030 (S1). Then, cable rebounded somewhat. The short-term bias remains negative and hence, I believe that sellers will take action soon and drive the battle towards the psychological zone of 1.5000 (S2). Bearing in mind our short-term momentum studies though, I see signs that the corrective bounce may continue for a bit before the next bearish leg. The RSI has bottomed within its below-30 zone, while the MACD, even though at extreme negative levels, has started bottoming. Switching to the daily chart, I see that the rate has moved well below the 80-day exponential moving average. What is more, the close below 1.5100 (R1) has turned the medium-term picture negative and supports that we are likely to see cable trading lower in the not-too-distant future.
• Support: 1.5030 (S1), 1.5000 (S2), 1.4965 (S3)
• Resistance: 1.5100 (R1), 1.5140 (R2), 1.5200 (R3)
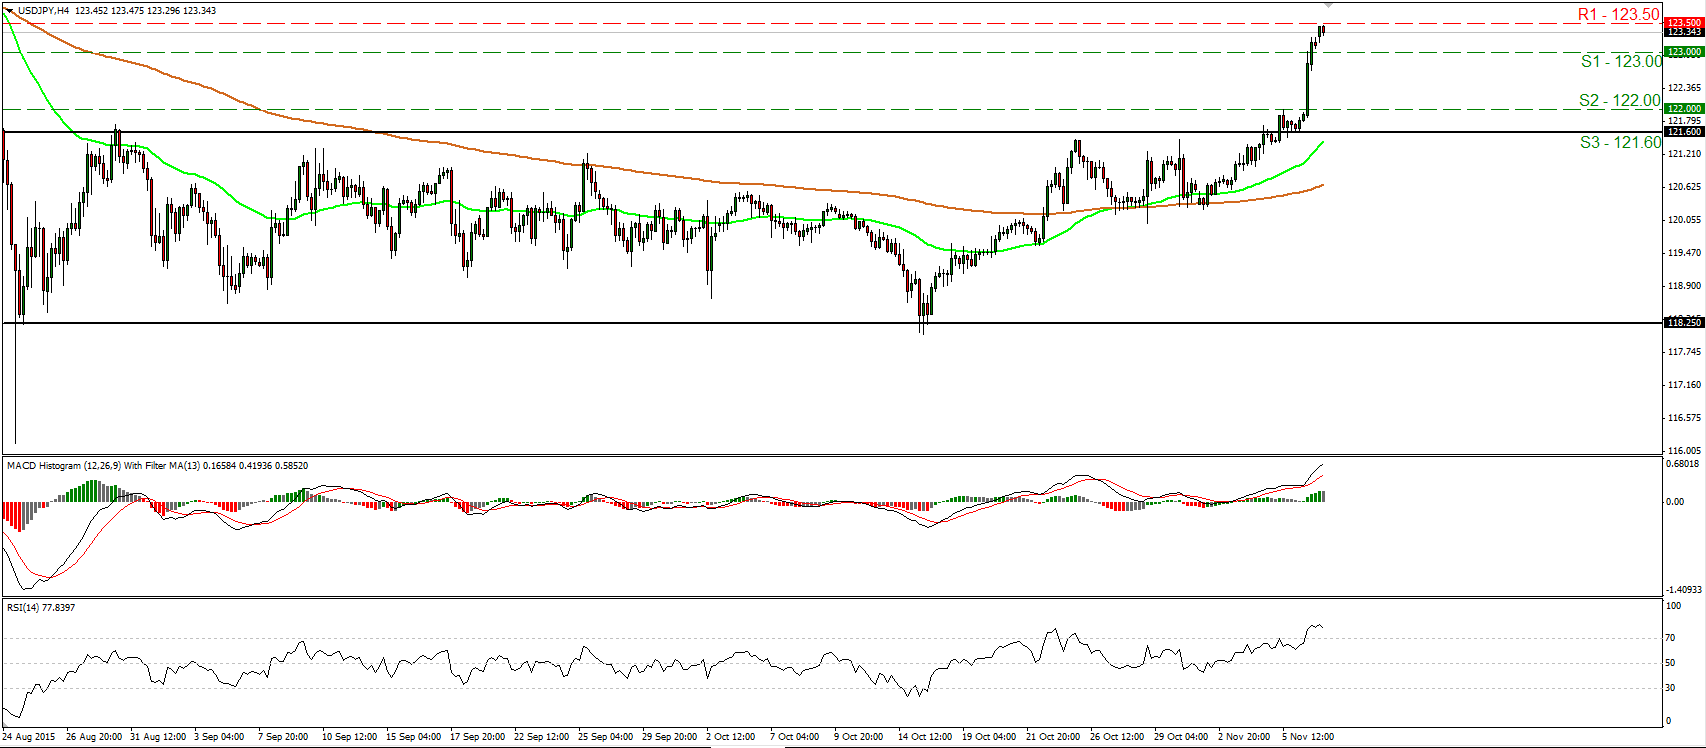
USD/JPY surges above 122 after the US employment report
• USD/JPY rallied following the much-more-than-expected increase in the US nonfarm payrolls, breaking above the 122.00 (S2) level to find resistance marginally below 123.50 (R1). The bias remains positive in my opinion and therefore, I would expect a clear move above 123.50 (R1) to pave the way for our next resistance of 124.00 (R2). However, our short-term oscillators give evidence that a minor setback could be on the cards before the bulls take the reins again. The RSI has topped within its above-70 zone, while the MACD, although above both its zero and trigger lines, shows signs that it could start topping. As for the broader trend, the break above 121.60 (S3) signaled the upside exit of the sideways range the pair had been trading since the last days of August and turned the longer-term picture back positive.
• Support: 123.00 (S1), 122.00 (S2), 121.60 (S3)
• Resistance: 123.50 (R1), 124.00 (R2), 124.60 (R3)
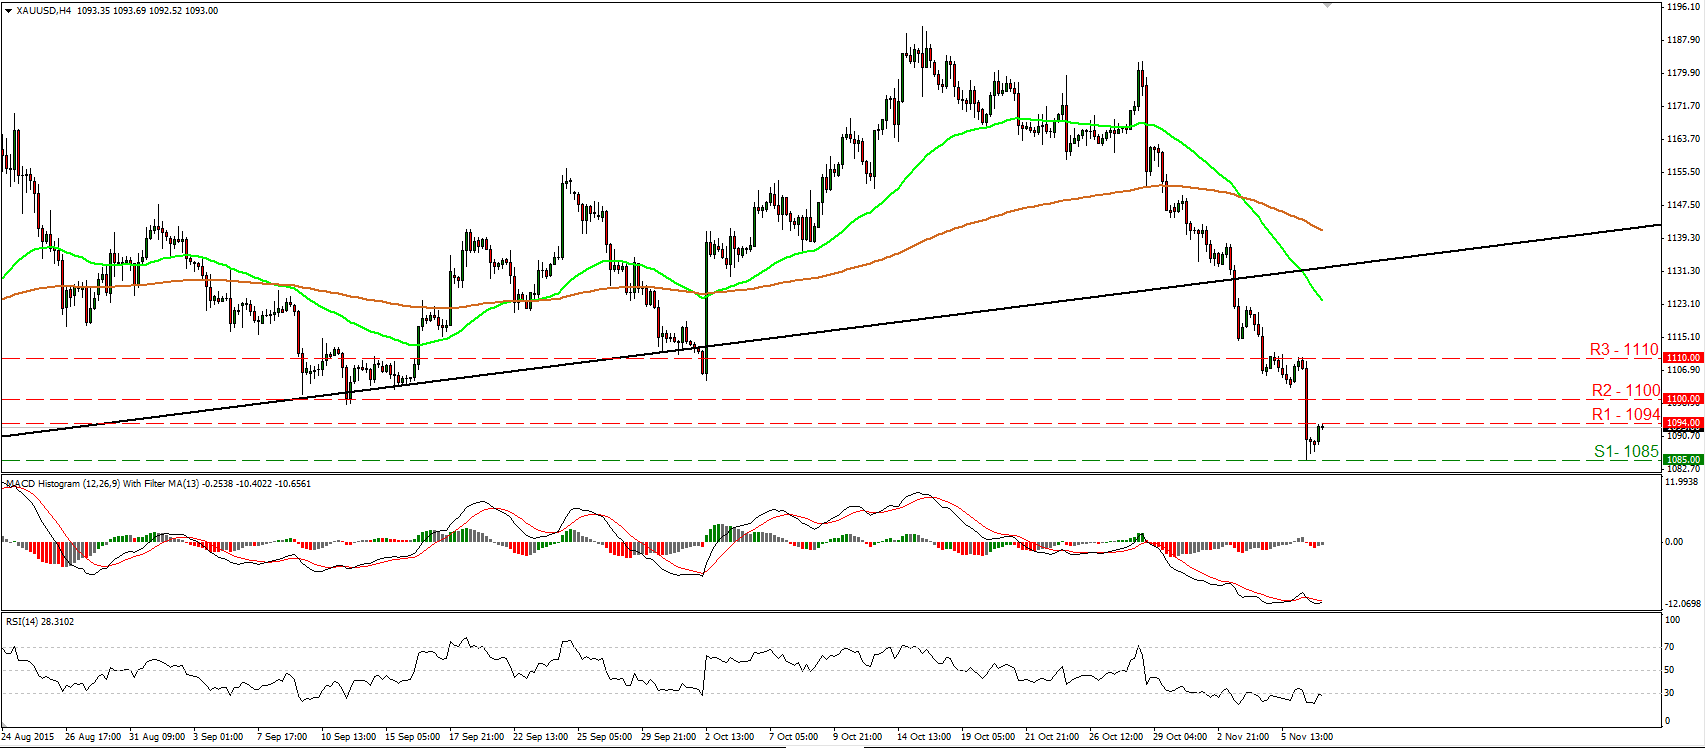
Gold falls below 1100
• Gold tumbled on Friday following the astonishing surge in the US nonfarm payrolls, and fell below the psychological zone of 1100 (R2). Subsequently, the metal hit support at 1085 (S1) and then it rebounded. The short-term trend remains negative in my view and thus, I would expect the bears to take control again at some point and push the price for another test at 1085 (S1). A move below 1085 (S1) could aim for our next support of 1080 (S2). Nevertheless, looking at our short-term oscillators, I see signs for the current rebound to continue for a while before sellers decide to shoot again, perhaps to challenge the 1100 (R2) zone as a resistance this time. The RSI has bottomed within its oversold territory, while the MACD has bottomed and could move above its signal line soon. On the daily chart, the plunge below the upside support line taken from the low of the 20th of July has shifted the medium-term outlook to the downside. This supports that the metal is poised to trade lower in the foreseeable future.
Support: 1085 (S1), 1080 (S2), 1072 (S3)
• Resistance: 1094 (R1), 1100 (R2), 1110 (R3)
DAX futures rebound from an uptrend line
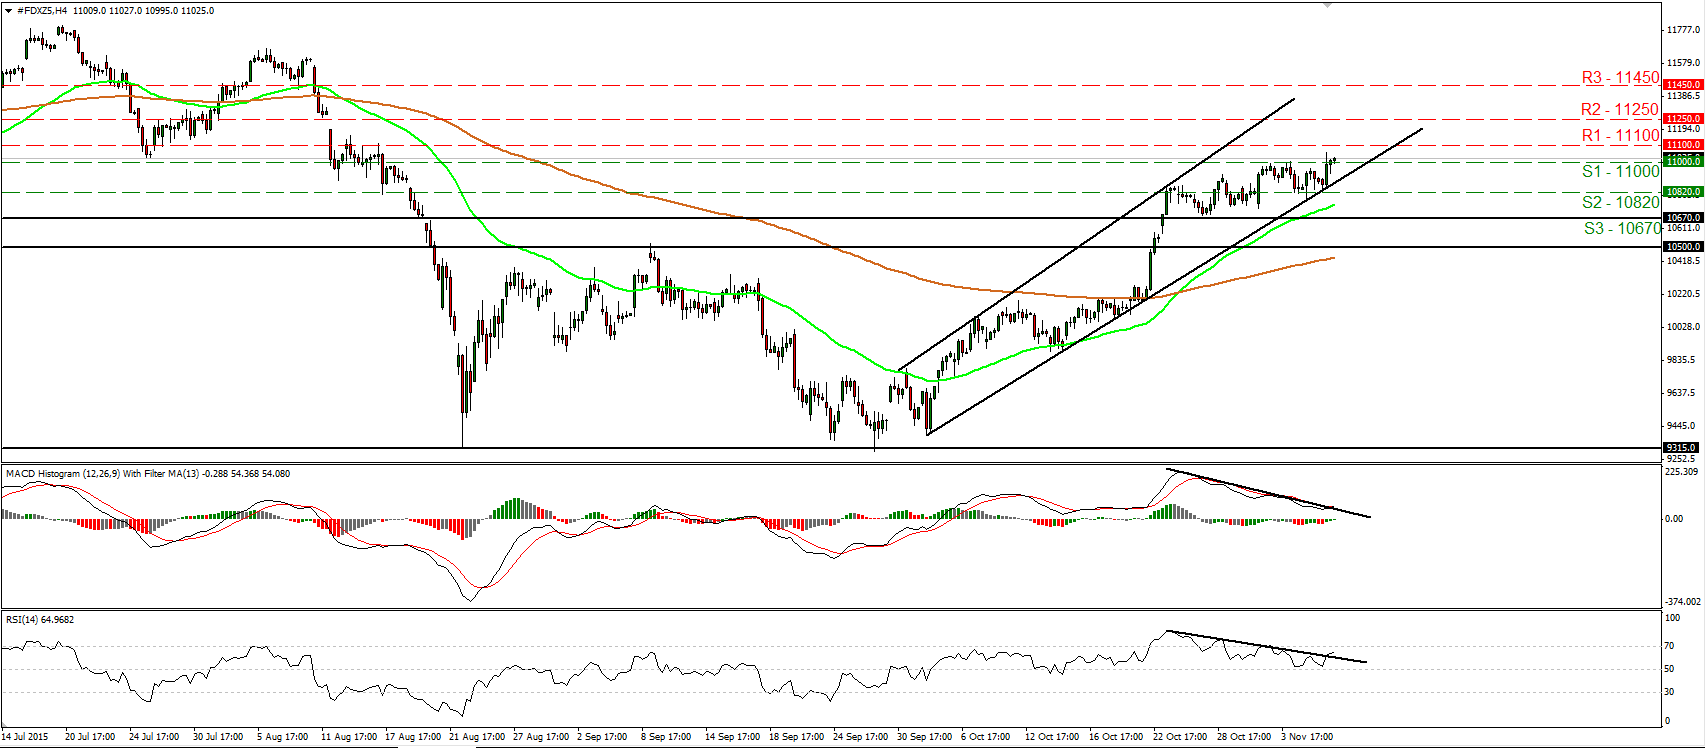
• DAX futures traded higher on Friday after hitting support at the uptrend line taken from the low of the 2nd of October and managed to overcome the psychological line of 11000 (S1). The index is now headed towards the 11100 (R1) barrier, where a clear break is likely to prompt extensions towards our next resistance obstacle of 11250 (R2). Our short-term oscillators detect upside momentum and support the case for further advances. The RSI rebounded from slightly above 50 and moved above its downside resistance line, while the MACD, already positive, has bottomed and has just poked its nose above both its downside resistance and trigger lines. On the daily chart, the break above the psychological zone of 10500 signalled the completion of a possible double bottom formation. Moreover, on the 23rd of October buyers managed to overcome the key obstacle of 10670. These technical signs support that the index is likely to continue trading higher in the foreseeable future.
• Support: 11000 (S1), 10820 (S2), 10670 (S3)
• Resistance: 11100 (R1), 11250 (R2), 11450 (R3)

