
SolarEdge Technologies (NASDAQ:SEDG) reported fourth-quarter 2018 adjusted earnings of 63 cents per share, which missed the Zacks Consensus Estimate of 70 cents by 10%. The bottom-line figure also declined 25.9% from 85 cents registered in the prior-year quarter.
Barring one-time adjustments, the company posted GAAP earnings of 27 cents per share compared with 42 cents in the year-ago quarter.
For 2018, SolarEdge’s adjusted earnings came in at $3.17 per share, which fell short of the Zacks Consensus Estimate of $3.19 by 0.6%. The reported figure, however, improved 30.4% from $2.43 a year ago.
SolarEdge Technologies, Inc. Price, Consensus and EPS Surprise
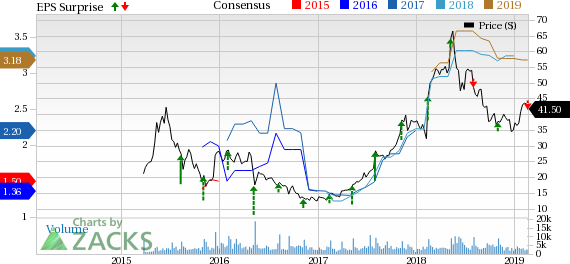
SolarEdge Technologies, Inc. Price, Consensus and EPS Surprise | SolarEdge Technologies, Inc. Quote
Revenues
Solar Edge’s revenues of $263.7 million in the fourth quarter surpassed the Zacks Consensus Estimate of $249.2 million by 5.8%. The top line also surged 39% from the year-ago quarter’s $189.3 million.
For 2018, the company’s revenues of $937.2 million exceeded the Zacks Consensus Estimate of $922.7 million by 1.6% and surged 54% from the year-ago tally.
Operational Highlights
While SolarEdge shipped a total of 1.1 Gigawatts (AC) of inverters in the reported quarter, it shipped 3.9 Gigawatts (AC) of inverters during the full year.
Gross profit totaled $79.7 million, up 12.3% from $71 million a year ago.
Total operating expenses increased 52% year over year to $55.3 million owing to higher research and development, sales and marketing as well as general and administrative expenses.
Operating income during the quarter was $24.4 million, up approximately 29.5% from $34.6 million in the year-ago quarter.
Financial Performance
SolarEdge had $191.6 million of cash and cash equivalents, as of Dec 31, 2018, up from $163.2 million at the end of 2017.
Cash flow from operating activities amounted to $189.1 million at 2018 end, up from $136.7 million a year ago.
Long-term liabilities were $168 million at the end of 2018 compared with $114.1 million as of Dec 31, 2017.
Guidance
For first-quarter 2019, SolarEdge expects to generate revenues in the range of $260-$270 million. The Zacks Consensus Estimate for the same is pegged at $231.7 million, lower than the company’s guided range.
Additionally, revenues from solar products during the first quarter are projected to be between $245 million and $255 million.
While the company’s GAAP gross margins are expected to be 30-32%, gross margins from the sale of solar products are expected to be 32-34%.
Zacks Rank
SolarEdge currently carries a Zacks Rank #4 (Sell).
A Recent Solar Release
SunPower Corp. (NASDAQ:SPWR) incurred fourth-quarter 2018 adjusted loss of 21 cents per share, narrower than the Zacks Consensus Estimate of a loss of 38 cents.
Upcoming Solar Releases
Canadian Solar Inc. (NASDAQ:CSIQ) is scheduled to release fourth-quarter 2018 results on Mar 21. The company sports a Zacks Rank #1 (Strong Buy). You can see the complete list of today’s Zacks #1 Rank stocks here.
Enphase Energy, Inc. (NASDAQ:ENPH) is scheduled to release fourth-quarter 2018 results on Feb 26. The company carries a Zacks Rank #3 (Hold).
Today's Best Stocks from Zacks
Would you like to see the updated picks from our best market-beating strategies? From 2017 through 2018, while the S&P 500 gained +15.8%, five of our screens returned +38.0%, +61.3%, +61.6%, +68.1%, and +98.3%.
This outperformance has not just been a recent phenomenon. From 2000 – 2018, while the S&P averaged +4.8% per year, our top strategies averaged up to +56.2% per year.
See their latest picks free >>
SolarEdge Technologies, Inc. (SEDG): Free Stock Analysis Report
Canadian Solar Inc. (CSIQ): Free Stock Analysis Report
SunPower Corporation (SPWR): Free Stock Analysis Report
Enphase Energy, Inc. (ENPH): Free Stock Analysis Report
Original post
Zacks Investment Research