Last week’s price action across the soft commodity sector can best be described as one of a modest recovery, punctuated by volatile price action towards the end of the week with the trigger being the WASDE report. The release was one of mixed messages, suggesting that the actual harvest might come in lower than anticipated, whereas the market has been geared to the expectation of record yields. The weather too played its part in last week’s modest recovery as the rains moved in, slowing the harvesting within many of the growing belts.
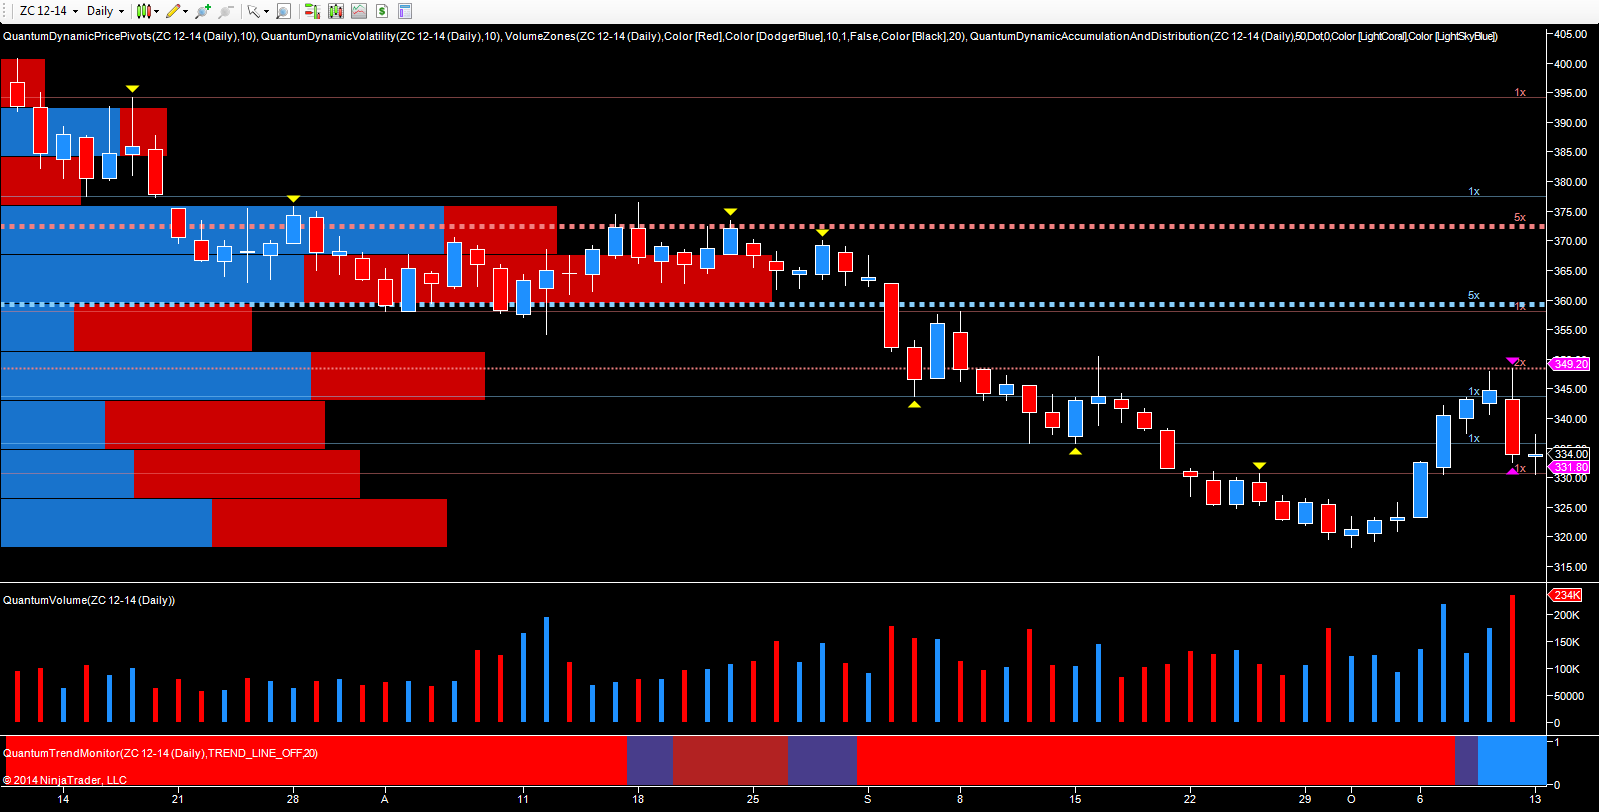
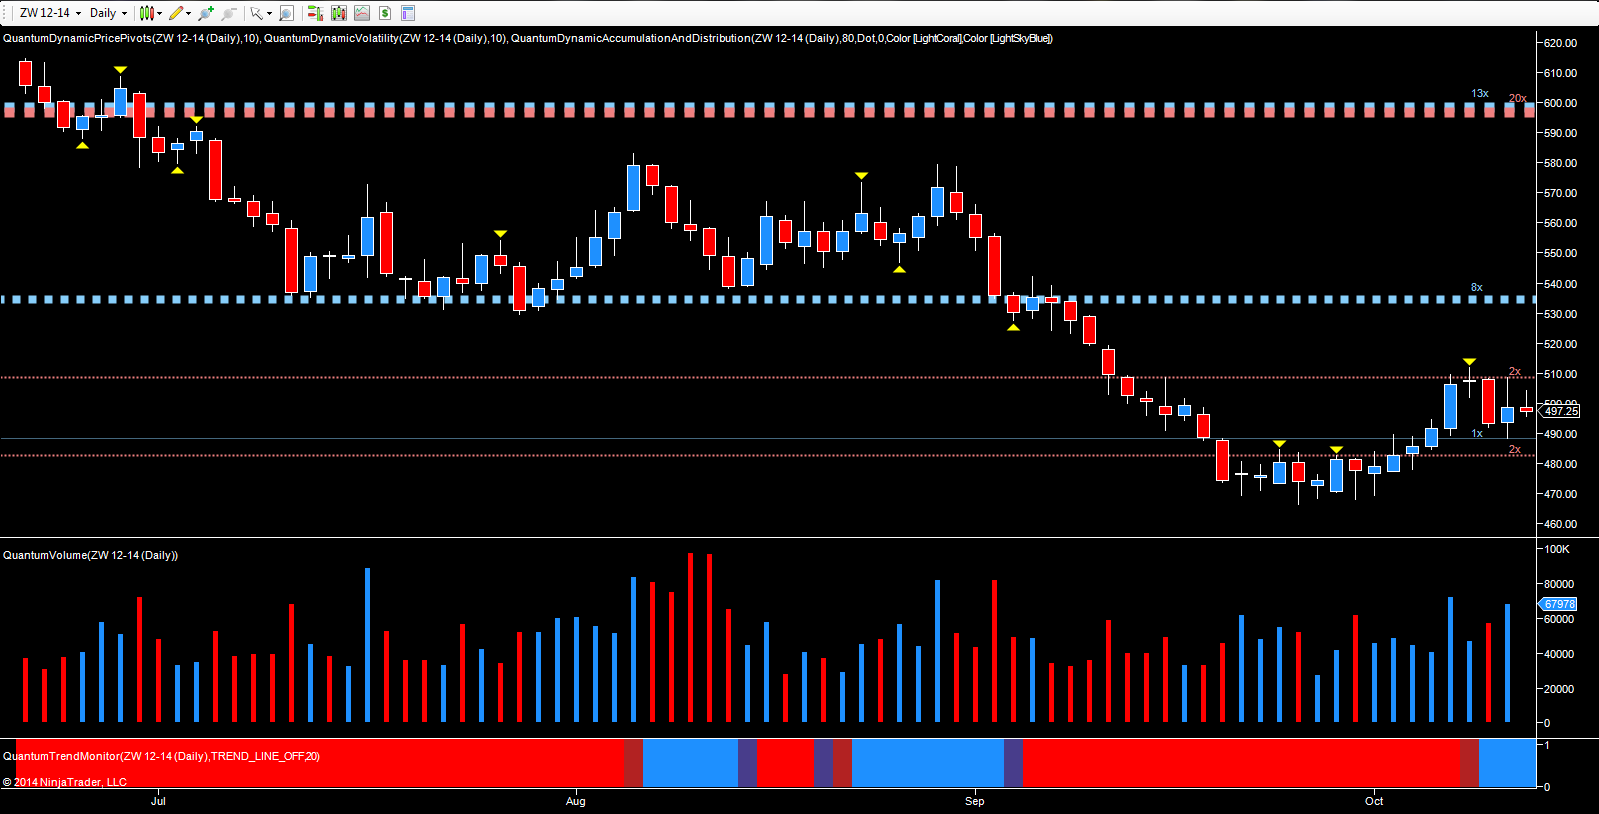
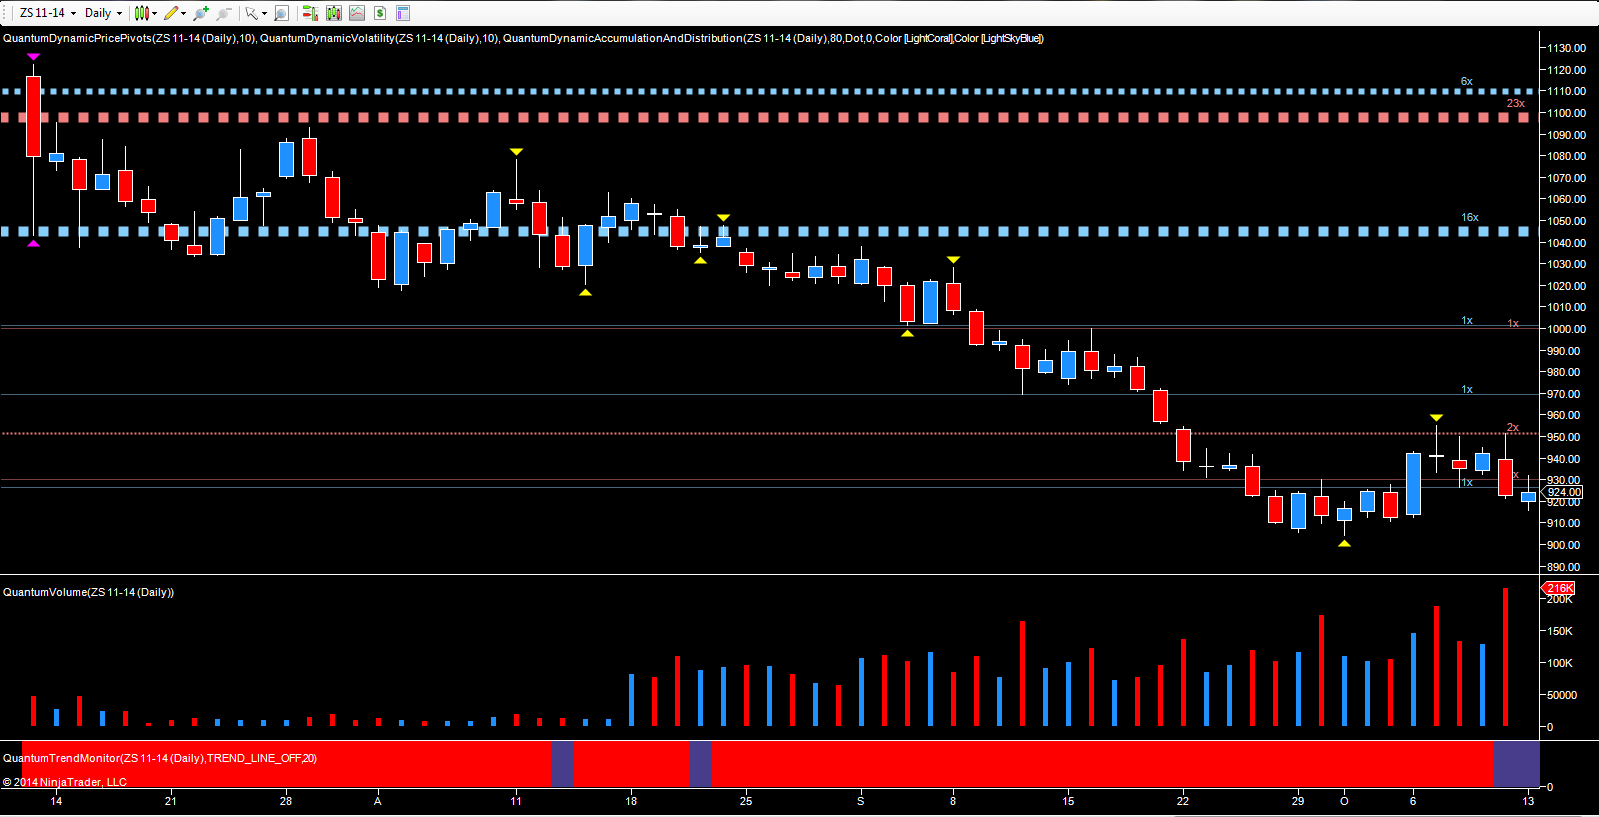
From a technical perspective, last week was a game of two halves, with the early promise of a possible recovery duly snuffed out towards the end of the week, suggesting this was simply a minor bounce in the longer term downward trend, with corn, soybeans and wheat all reflecting similar price action on the daily charts.
If we start with corn, the initial rally was associated with positive, wide-spread up candles on rising volume, as prices moved back to test resistance in the 338 to 344 per bushel area. However, Thursday’s candle suggested weakness as the high of the session tested and failed at the resistance level in the 348.50 region. This was a price point that was tested again on Friday before moving sharply lower to close the week at 334 per bushel on high volume signaling bearish sentiment returning once again.
In early trading this morning, and with the markets closed for Columbus Day celebrations, trading has been muted with the commodity oscillating in a tight range in the 333 per bushel region.

Wheat followed much the same price action pattern, with Wednesday’s doji candle testing the resistance level in the 510 per bushel region before weakness on Thursday and Friday duly tested and failed to hold at these levels once again. Friday’s candle with a deep upper wick also suggests further weakness in the short term, given the depth of the upper wick, the resistance now overhead, and the strength of the volume which failed to move the market higher in the trading session. As with corn, this morning’s trading session has been muted in the electronic market with the commodity holding below the 500 per bushel region to trade at 496.75 at the time of writing.

And so to soybeans, which perhaps gave the clearest signals of the three, with Tuesday’s shooting star candle associated with high volume and consequent pivot high, duly validated later in the week as the commodity failed to breach the psychological 950 per bushel region, before closing on Friday sharply lower with a wide spread down candle and ultra high volume. The market is now testing the $910 to $920 per bushel area once more and any move through here in the short term, may see further weakness for soybean and indeed the other grains in due course.
Finally, the CRB Index continues to remain bearish, closing down once again on Friday at 275.60, 0.29% on the day, and with the US dollar continuing to remain firm, the supply-demand equation continues to dominate.
Which stock should you buy in your very next trade?
With valuations skyrocketing in 2024, many investors are uneasy putting more money into stocks. Unsure where to invest next? Get access to our proven portfolios and discover high-potential opportunities.
In 2024 alone, ProPicks AI identified 2 stocks that surged over 150%, 4 additional stocks that leaped over 30%, and 3 more that climbed over 25%. That's an impressive track record.
With portfolios tailored for Dow stocks, S&P stocks, Tech stocks, and Mid Cap stocks, you can explore various wealth-building strategies.
