I’ve been so busy this afternoon, I’ve been racked with guilt about not being able to sit down and do a post. But here I am, so I’ll get on it…….
The bear market was supposed to really kick in full-force a year ago. News flash: it didn’t. Allow me to show you what I mean by this.
Ramping up to the market peak in 2000, the market had a firm, steady move higher, it peaked (cyan tint), stumbled a little, regained its footing, peaked again (magenta), and then began an honest-to-God bear market lasting from 2000 to 2002. (Yes, children, there was a time when bear markets could be measured in years, not minutes).
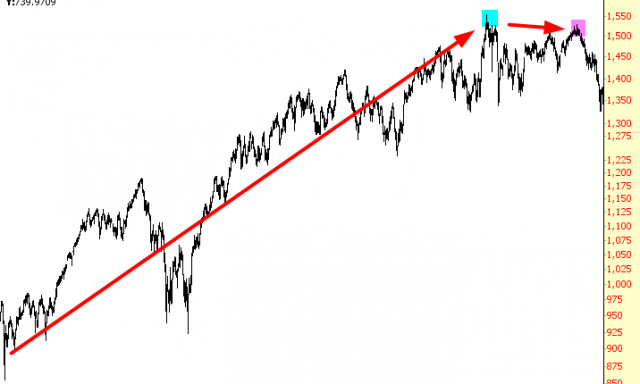
In the peak prior to the financial crisis, it was the same story; steady, robust bull market, a peak, a stumble, an attempt to recapture the glory of old, another peak, and then – wham-o, bam-o, down we go-go.
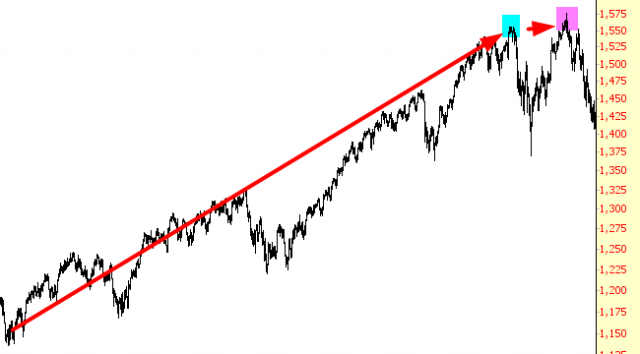
And, having endured the agonizing run-up from early 2009 to late 2015, I was delighted to see us reverse with a top (cyan, yet again), a hard drop, and then a recovery (magenta). We were beginning to roll over into our third major bear market. Now was our time.
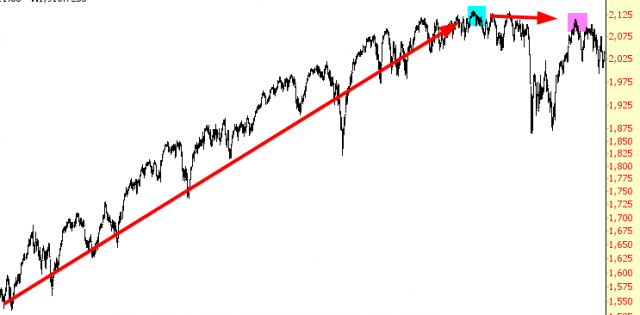
And, God bless it, the chart worked. We started falling, and falling hard. Everything was working, and it looked like a drop bigger than the financial crisis was a real possibility.
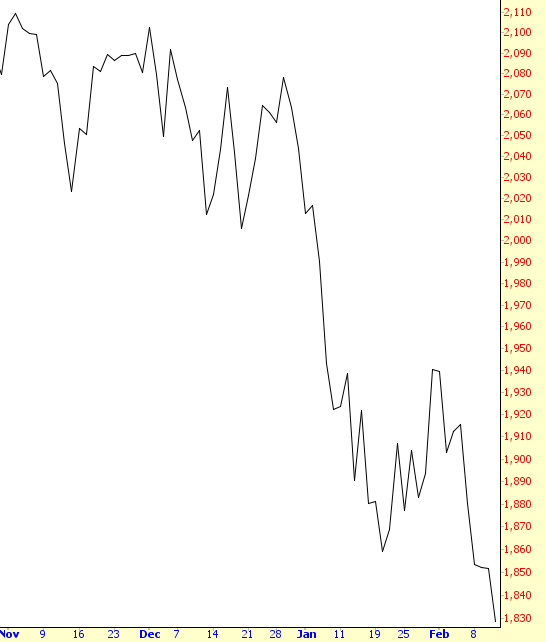
Well, my friends, you know what happened next. Somehow – maybe you know how, but I don’t – but somehow, the third downturn was aborted. The initial drop, represented in the chart above, is tinted in the chart below, and as you can see, it has been dwarfed by the almost totally uninterrupted rise that led to lifetime high after lifetime high, day after rotten day.
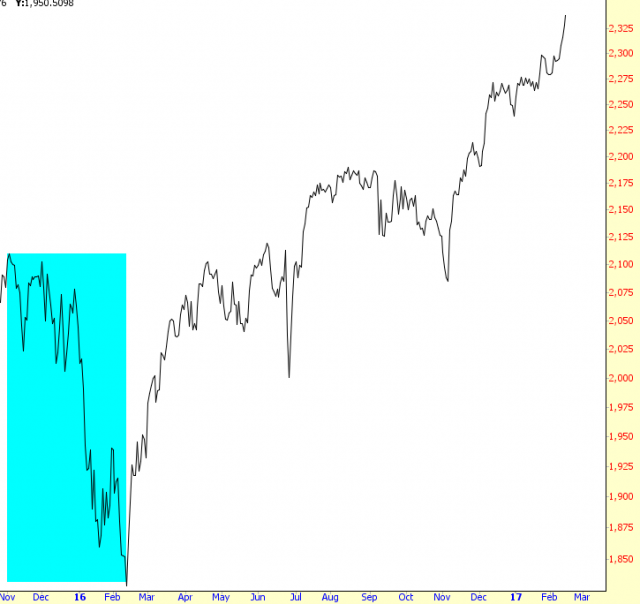
So, I gotta tell ya, I feel pretty cheated. These aren’t small cycles. These are huge cycles representing many trillions of dollars in both upward and downward directions. And if you look at any really long-term chart, it make perfect sense for the swoon to completely kick in a year ago, almost precisely to the day (it was actually the 11th, but close enough).
For someone with my own proclivities, such a situation is bad in multiple dimensions. It diminishes traffic and interest in my blog, on which I have labored some 143 months now. It causes my Slope Plus members, faced with their own market frustrations, to slip toward the Exit door. And, naturally, it makes my trading very tough.
The perverse irony to all of this is that, from a net worth perspective, nothing could be better for me than a market that just keeps climbing, because my most important assets are all tied to it. Indeed, the market could go from 2350 on the S&P down to, I dunno, 400 points, over the course of years, and although it would make me one hell of a popular blogger, it would have a pretty horrible, multi-million dollar negative effect on my net worth. So I’d have a shiny dime in one hand in exchange for giving up five bucks in the other.
Sorta weird that I’d still yearn for a bear market, isn’t it? But we’re not all very rational creatures. In any case, even though I sometimes claim I don’t have much patience, I actually have far, far too much of it. And, even so, my patience is just about out. This little endurance contest is approaching unbearable.
