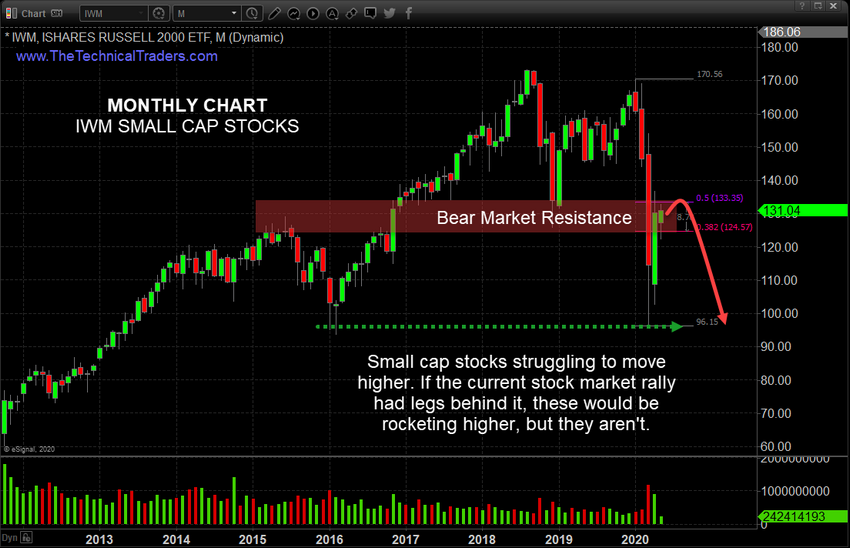
Our research team believes the Russell 2000 is leading the way in terms of technical analysis and future expectations. While the NASDAQ has rallied as a result of US Fed stimulus and foreign investor activity, the Russell 2000 has set up a very clear price resistance level near $131~132 that presents very real potential for a double-dip downward price trend in the near future.
Monthly IWM ETF Chart
The resistance level near $131~132 suggests the iShares Russell 2000 ETF (NYSE:IWM) may rotate downward, creating a right-shoulder, and likely attempt to move down to the $96 previous lows. If this resistance area can’t be breached by further upside price activity, then the price will likely attempt to rotate lower and retests multiple levels as price collapses back below $100 again. The lack of upward price activity in the Russell 2000, and other market sectors, suggests the rally is isolated to the NASDAQ and certain other symbols—not broad-based.

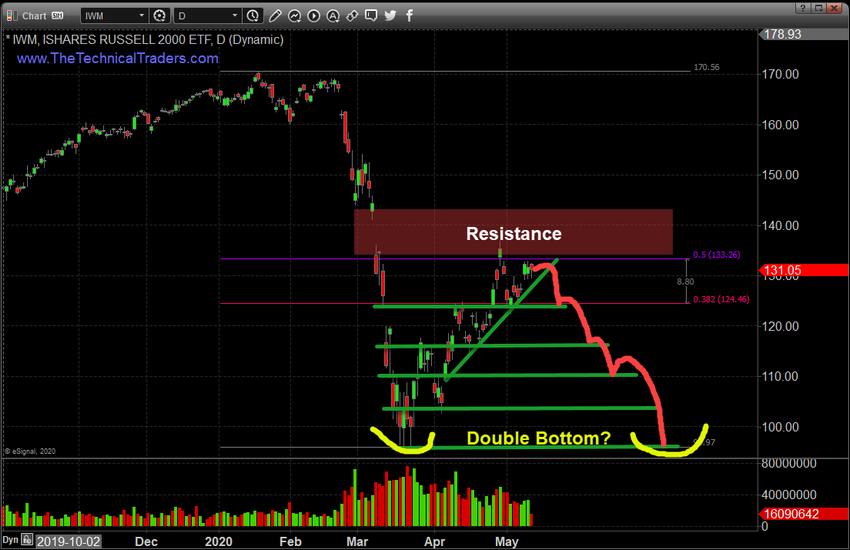
Daily IWM ETF Chart
This Daily IWM chart highlights the multiple levels of support below the current price levels. Each of these may act as some form of a soft floor in price as price attempts to move lower. Again, the lack of price to attempt to rally above the RED Resistance level on this chart suggests the Russell 2000 may have found a top and may begin to “rollover” as momentum diminishes.
If stocks are set to fall something else should start to rally.

Concluding Thoughts
Technical Traders watch for these types of patterns because they provide an A or B type of scenario for profits. Either, A, upper Resistance will be broken and the IWM will really past $140 and attempt a further upside price rally.. or, B, this resistance level will hold price below $140 and present a very real downside price opportunity where price may attempt to fall well below $110.
Our concern is that the initial downside price move in the markets, as a result of the COVID-19 virus event and global shutdown event, was followed by a Fed-induced “relief rally” that may be ending. Most of the time, these big impulse moves result in a “relief recovery” before further trending takes place. We believe the relief recovery is nearly over and the global markets may be setting up for a much bigger trending move.
