It is early, but October has been the least volatile month...EVER.
If today was the end of the month, this would be the quietest October on record and it would also be the quietest month ever. Of course, it is too early to suggest that is what is in store for the markets come October 31st, but it should at least offer some perspective.
Further, it has been almost a year without a 3% drawdown in the S&P 500. This is the second longest run of its kind in history. If the market survives the next 10 days, it will beat the previous record. Keep in mind, 3% is literally a drop in the bucket. At today's price, that would be a mere 75 ES points.
We don't when the dam will break, but we do know it always does, eventually. Traders should be on their toes. Afterall, investor complacency is at an all-time high and historically such environments haven't ended well.
As mentioned in a previous newsletter, the University of Michigan stock market sentiment index measuring the percentage of investors that believe the stock market will be higher a year from now is at an all-time high. Similarly, credit spreads are near historical lows (this is the difference between the yield on high-risk securities and risk-free Treasury securities). Tight credit spreads suggest investors are reaching for yield and lack concern for economic turmoil (in short, they are complacent). The last time we saw such tight credit spreads was mid-2007, just prior to the financial collapse. We aren't predicting a repeat of 2007, we are simply saying the bulls should consider exercising caution. Is anybody familiar with "Old Man Partridge" from "Reminiscences of a Stock Operator"? The trend is only your friend until it ends.
Treasury Futures Markets
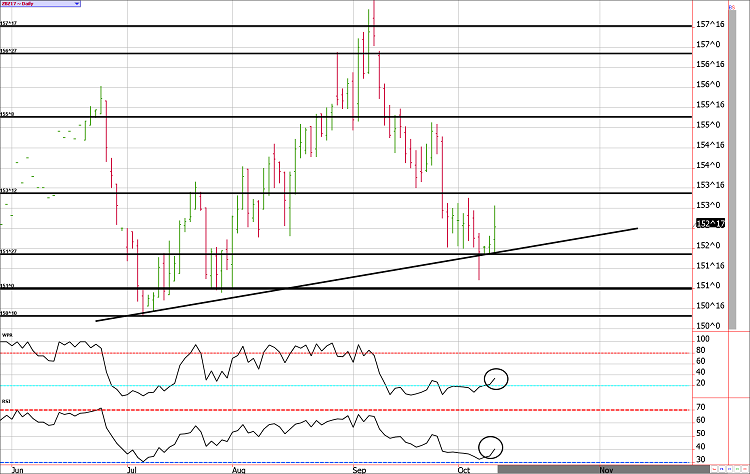
Treasuries are firming up, but stocks will need to roll over to keep the momentum going.
Bonds and notes have found buyers, despite TV pundits seemingly in agreement that a 3% yield on the 10-year note is imminent. We continue to believe that seasonal pressures and an eventual correction in the equity market will keep Treasuries in favor in the short-run (this should put upward pressure on Treasury securities and downward pressure on yields).
In our view, the best thing that could have happened to the Treasury market was the Friday morning post-jobs report flush. Now that all of the sell stops have been elected, the weak-handed bulls were forced out and the late-comer bears have been lured in, the path of least resistance should be higher.
We think the 30-year bond could see just over 155 and the 10-year note could see the mid-126 area.
Treasury Futures Market Analysis
**Bond Futures Market Consensus:** Treasuries posted a key-reversal following Friday's jobs report. The path of least resistance should be higher overall.
**Technical Support:** ZB : 151'26, 151'0, 150'10 and 149'07 ZN: 124'31, 124'21, 124'13, and 124'03.
**Technical Resistance:** ZB: 153'12, 155'8, 156'27, and 157'19 and 158'11 ZN: 125'20, 126'15, 127'08 and 127'25
Stock Index Futures
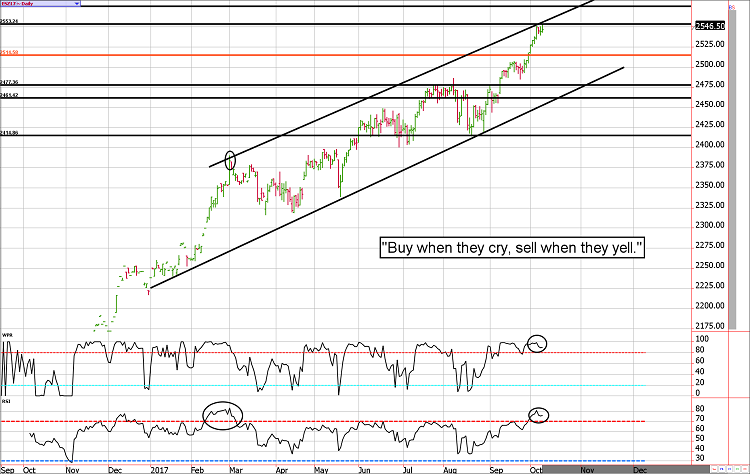
The ES bull is magnificent.
There isn't much more to say about the E-mini S&P other than this is the bull market we will be telling our grandchildren about.
There is no price limit to a runaway market, we've learned that lesson over and over. Yet, we do know that eventually, the excitement dries up. When that happens, those that were scrambling to buy at the highs will be scrambling to sell near the lows. Unfortunately, it is human nature to do so and the collective reaction to fear and greed are what tops and bottoms are made of.
Stock Index Futures Market Ideas
**E-mini S&P Futures Market Consensus:**
The ES has surpassed our expectations, but that doesn't change the big picture. It is a better "sell" than it is a "buy" from these levels.
**Technical Support:** 2514, 2477, 2460, and 2414
**Technical Resistance:** 2556, 2574, and 2595
E-mini S&P Futures Day Trading Ideas
**These are counter-trend entry ideas, the more distant the level the more reliable but the less likely to get filled**
ES Day Trade Sell Levels: 2556 and 2574
ES Day Trade Buy Levels: 2538, 2528, 2515, and 2500
In other commodity futures and options markets....
July 28 - Buy December Copper $2.50 puts for about $200.
August 9 - Buy December wheat $5.50 calls for about 5 cents.
August 16 - Buy the December wheat futures near $4.50 and sell a $4.50 call for about 19 cents.
August 22 - Sell December hog 52 puts for 1.30 (or $520).
August 24 - Go long March corn near 3.68 and sell a 3.70 call near 19 cents.
September 8 - Buy December crude oil $41 puts near 22 cents ($220).
September 15 - Sell December ES future near 2493 and then sell a December 2500 put against it. The net credit is about 45.00.
September 20 - Exit bearish ZN position to lock in a profit of $500 to $600 per lot depending on fill prices.
September 25 - Exit the December wheat covered puts to lock in a gain of between $350 and $400 before transaction costs.
October 2 - Lock in a gain on the short December hog 52 put. The profit should be about $270ish per lot before transaction costs.
October 3 - Covered calls in the 10-year note; go long the March ZN future near 125'0 and sell a 125'0 call against it for about 1'0.
October 4 - Adjust the bearish ES trade by buying back the December 2500 put and then selling the January 2500 put. This adds about 20 points to the profit potential and offers a better risk buffer on the upside.
October 10 - Go long October VIX near 10.95.
**There is substantial risk of loss in trading futures and options.** These recommendations are a solicitation for entering into derivatives transactions. All known news and events have already been factored into the price of the underlying derivatives discussed. From time to time persons affiliated with Zaner, or its associated companies, may have positions in recommended and other derivatives. Past performance is not indicative of future results. The information and data in this report were obtained from sources considered reliable. Their accuracy or completeness is not guaranteed. Any decision to purchase or sell as a result of the opinions expressed in this report will be the full responsibility of the person authorizing such transaction. Seasonal tendencies are a composite of some of the more consistent commodity futures seasonals that have occurred over the past 15 or more years. There are usually underlying, fundamental circumstances that occur annually that tend to cause the futures markets to react in a similar directional manner during a certain calendar year. While seasonal trends may potentially impact supply and demand in certain commodities, seasonal aspects of supply and demand have been factored into futures & options market pricing. Even if a seasonal tendency occurs in the future, it may not result in a profitable transaction as fees and the timing of the entry and liquidation may impact on the results. No representation is being made that any account has in the past, or will in the future, achieve profits using these recommendations. No representation is being made that price patterns will recur in the future.
