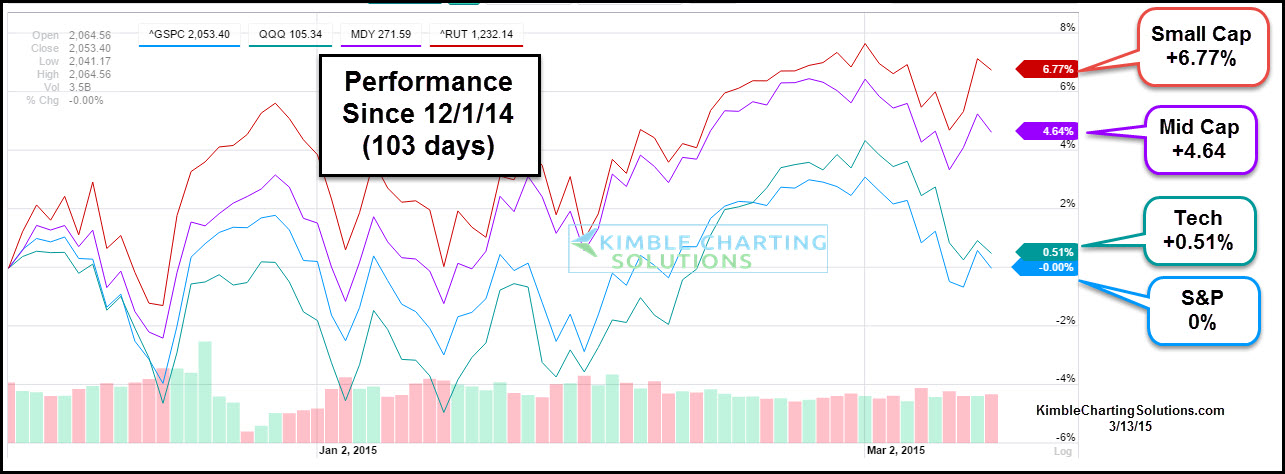
The above table looks at returns over the past 100 days (actually 103 days) for the S&P 500, the PowerShares QQQ (NASDAQ:QQQ)—the ETF that tracks the NASDAQ, the SPDR MidCap Trust Series I ETF (NYSE:MDY) and the Russell 2000 (RUT). It feels like the broad market has done OK of late, yet when looking at performance, the S&P has been rather flat. Actually really flat (0%), according to data coming from Yahoo Finance.
The RUT was in the news last year for being an under-performer. As you can see, over the past 100 days, Small Caps have actually done well. In fact, they are leading this pack—up 7% more than Large Caps.
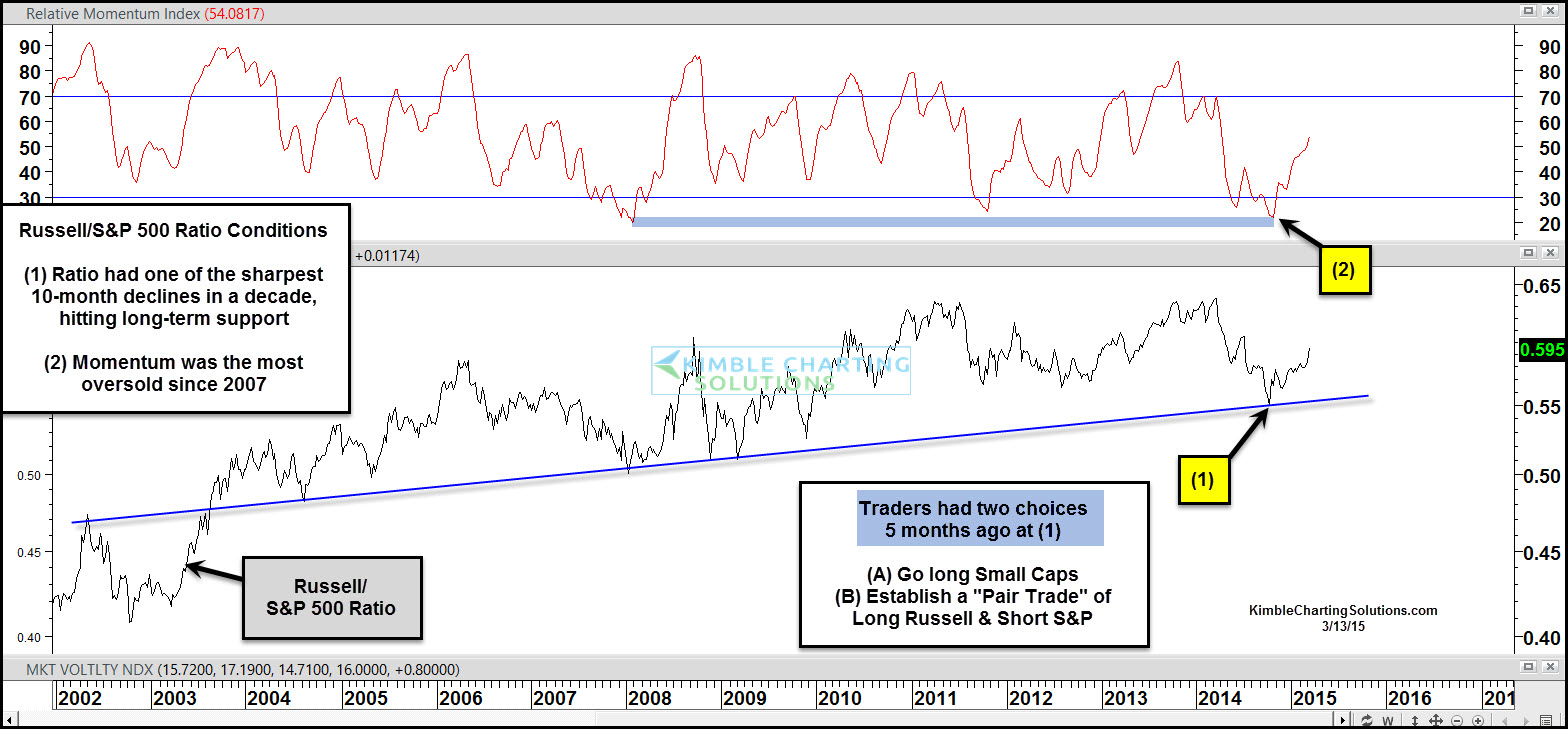
Five months ago this past Friday, the Power of the Pattern noticed that the Russell/SPY ratio had one of its largest declines in the past 10-years, taking it down to support at (1) and driving momentum to its most oversold levels since 2007 at (2).

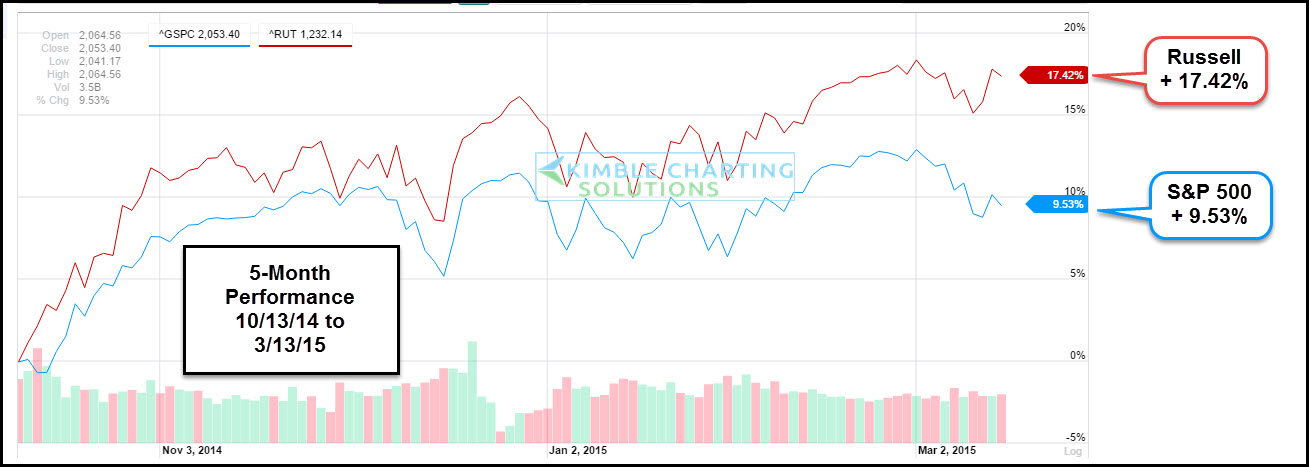
At the time, readers were instructed that two potential trades could be put in place. (A) go long Small Caps or (B) establish a pair trade of Long Russell/Short S&P 500.

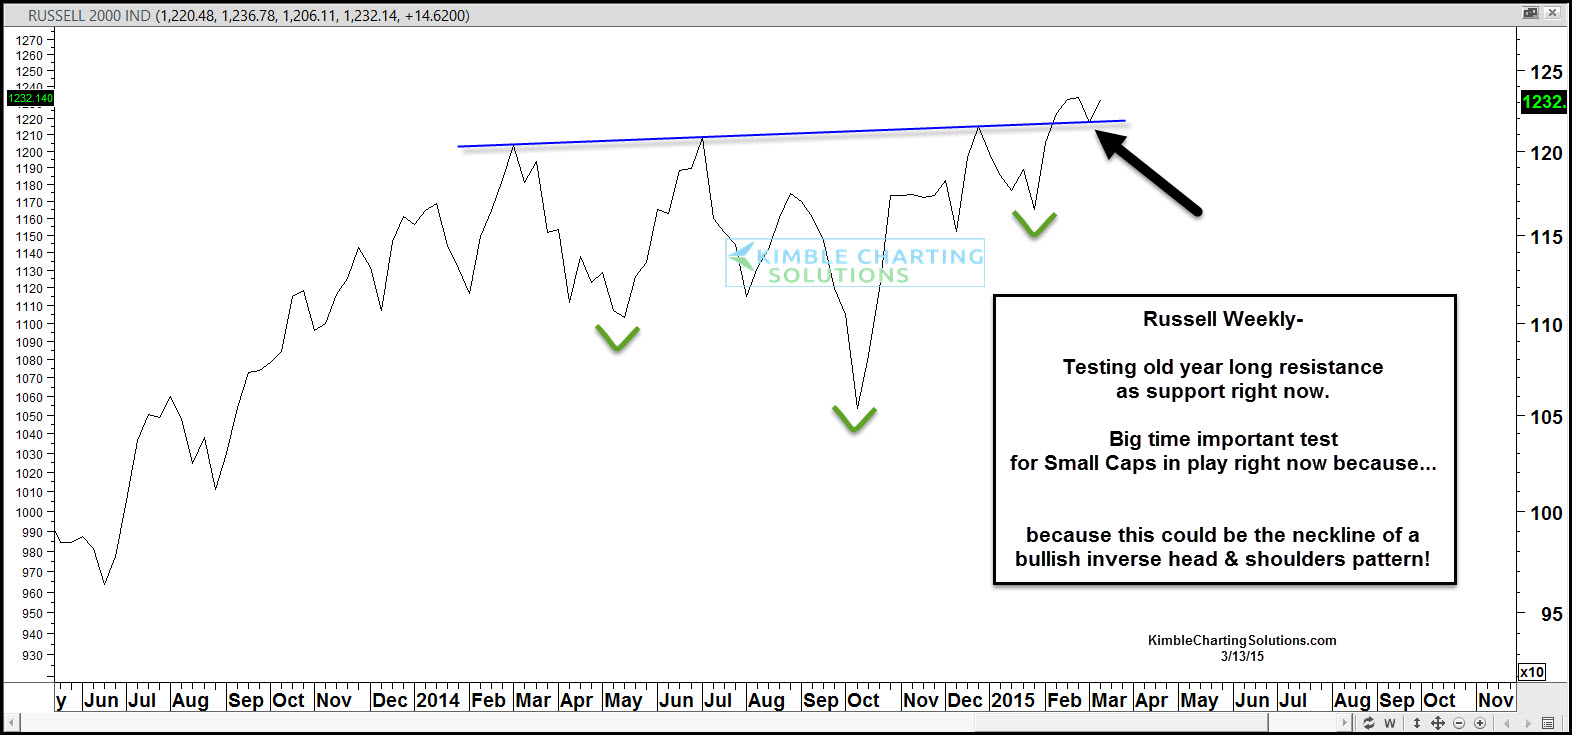
The above table shows that Small Caps have nearly doubled the performance of large caps in this time window. This trade deserves close scrutiny due to the price situation in which the Russell finds itself right now, see below:

Did the Russell create a bullish inverse head & shoulders pattern over the past year? For a good deal of time last year, the Russell found overhead resistance pretty heavy. Of late, the Russell is attempting to push above old resistance and is trying to test old resistance as new support. What the Russell does in the next few weeks could tell us a ton. Is this a very bullish pattern or a fake-out at resistance.
Stay tuned friends, this index has been a leader over the past five months and what it does from here, looks to be more important than usual!
