When good things are happening in the stock market, investors can be forgiven for forgetting about volatility.
Equities have enjoyed a remarkable run since the election—and were doing well leading up to it. This may have encouraged a pleasant bit of amnesia on the part of some investors that, as good contrarians who think constantly about market volatility, we would like to interrupt.
To be sure, a look at the VIX for both the small-cap Russell 2000 Index and large-cap S&P 500 over the last several years reveals some interesting developments.
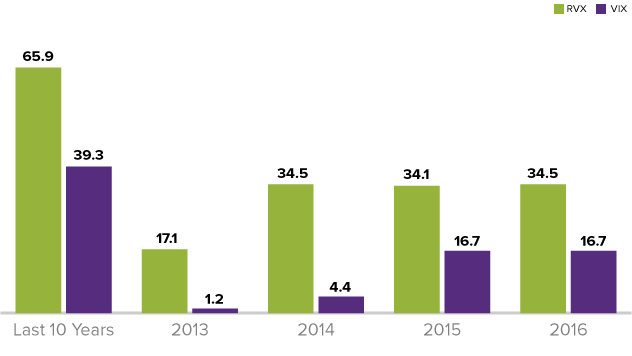
First, small-cap volatility has been steady. After dipping to a rate of 17.1% of days when its VIX was at or above 20 in 2013, the last three years have seen a higher, and remarkably consistent, level of volatility.
For the three-year span covering 2014, 2015, and 2016, the number of days when the VIX hit 20 or higher was, respectively, 34.5%, 34.1%, and 34.5%.
As close as these years were in terms of the number of days at 20 or higher, we also observed between 2013 and 2016 a gradual uptick in the average level of the VIX, from 18.12 in 2013 to 20.05 in 2016. (2014 was at 19.42 and 2015 at 19.39.)
A Look at Small-Cap and Large-Cap Volatility
CBOE Russell 2000 Volatility Index (RVX) versus CBOE S&P 500 Volatility Index (VIX)
Small-Cap volatility
The CBOE Russell 2000 Volatility Index (RVX) measures market expectations of near-term volatility conveyed by Russell 2000 stock index option prices. The CBOE S&P 500 Volatility Index (VIX) measures market expectations of near-term volatility conveyed by S&P 500 stock index option prices.
The very close levels of volatility for each of these three years, almost eerily uniform, is not necessarily the norm, and we would anticipate small-cap volatility moving higher in the years to come.
This would mirror what has already been happening in large-cap stocks, where the VIX spent the last two years at appreciably higher levels than the previous two.
Both small-cap and large-cap VIX indexes show more volatility in U.S. equities, with a dramatic move for large-cap from 2014 to 2015 (that held steady in 2016).
Small-cap’s dramatic move occurred a year earlier and, while staying consistent in terms of the number of days, the level of volatility rose closer to its 10-year average, a trend we suspect will continue.
This is consistent with our observation that a more normalized economy and capital markets will mean, at times at least, more volatility.
As small-cap active managers, this suits us just fine. One of the ways in which we seek to manage risk is by embracing volatility and the opportunities it creates.
It is during those times when the market is struggling to make up its mind that stocks are often most attractively mispriced. And therein lies one of the keys to outperformance for active managers—the identification and purchase of mispriced securities.
Stay tuned…

