Greetings, yet again, from seven miles above the United States. I am making my way back to my beloved Palo Alto with a subset of my nuclear family, after a successful fencing venture.
Well, this is quite a strange feeling, being out of my shorts and bullishly positioned (albeit with a modest capital allocation).
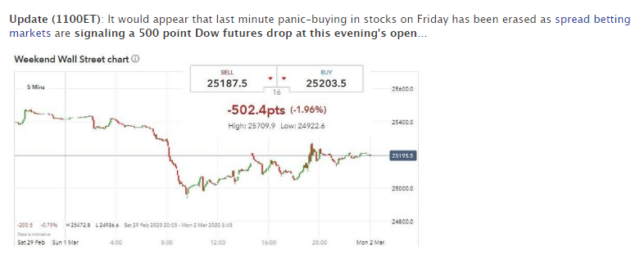
Of course, ZeroHedge loves to scare the holy hell out of everyone, with an everyone-is-going-to-die story every 17 minutes, and any bad market news in between. Early on Sunday, they were shouting about how the market was going to crash yet again.

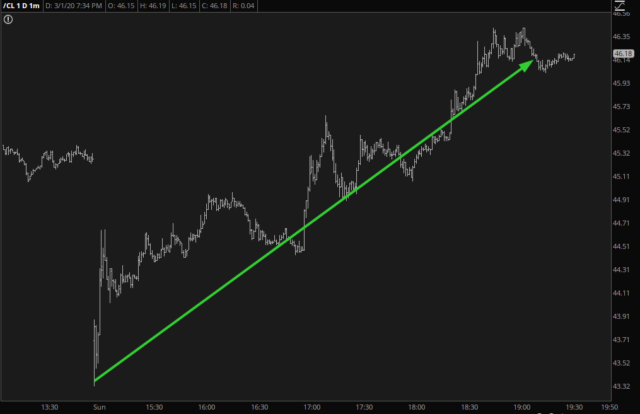
And indeed it did fall hard, and instantly. However, it became clear after the first hour or so that Friday’s lows weren’t going to be taken out, and then we started to see strength. Oil in particular is up smartly (which is good for me, in case it holds, since I am long XLE (NYSE:XLE) call options).

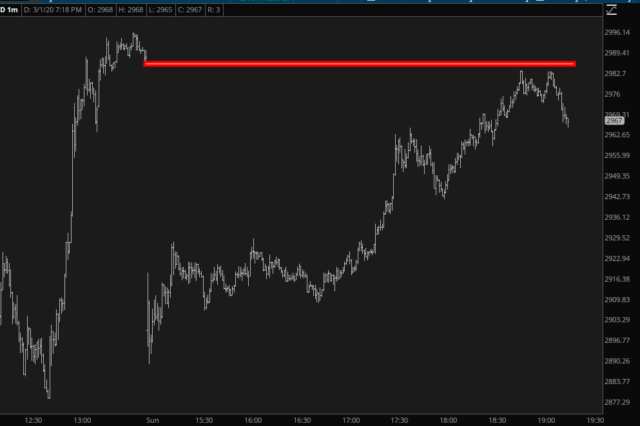
As I sit here, though, the most worrisome thing is that all the ES and NQ accomplished was to fill their monstrous gap between Friday’s close and Sunday’s open. It’s eerily clean.

Which leads me to this question: can anyone explain to me, as well as the rest of the group, why the ES and NQ are, at the moment, showing green double-digit gains, whereas the chart itself shows that the price action never exceeded Friday’s close? That doesn’t make any sense to me. Is it anchored to the time of the cash close? If so, that’s news to me, after literally decades of watching this stuff. Do tell!
