Breaking News
Get 45% Off 0
🤯 +96%, +62%, +40%: These AI-picked stocks are soaring!
See the list

Silver’s Leading the Way to New Yearly Lows

By Sunshine Profits (Przemyslaw Radomski, CFA)CommoditiesJan 22, 2024 03:07PM ET
www.investing.com/analysis/silvers-leading-the-way-to-new-yearly-lows-200645380
Silver’s Leading the Way to New Yearly Lows
By Sunshine Profits (Przemyslaw Radomski, CFA)   |  Jan 22, 2024 03:07PM ET
Saved. See Saved Items.
This article has already been saved in your Saved Items
 
 
XAG/USD
+1.99%
Add to/Remove from Watchlist
Add to Watchlist
Add Position

Position added successfully to:

Please name your holdings portfolio
 
Silver
+2.87%
Add to/Remove from Watchlist
Add to Watchlist
Add Position

Position added successfully to:

Please name your holdings portfolio
 
XAU/USD
+1.13%
Add to/Remove from Watchlist
Add to Watchlist
Add Position

Position added successfully to:

Please name your holdings portfolio
 
Gold
+1.84%
Add to/Remove from Watchlist
Add to Watchlist
Add Position

Position added successfully to:

Please name your holdings portfolio
 
GDXJ
+1.72%
Add to/Remove from Watchlist
Add to Watchlist
Add Position

Position added successfully to:

Please name your holdings portfolio
 

“Whites lead yellow” is one of the sayings about the precious metals market. And the white – silver – is down.

That saying describes one of the rules of thumb for the precious metals sector – that silver can be indicating something for gold. There are exceptions from this rule, as silver tends to outperform gold on a short-term basis close to local tops, but it seems that at this time, silver investors know something. Or, more precisely, they are reacting to something that gold or stock market investors don’t really sense yet. Mining stock investors appear to have “felt” it all along.

Miners' Plunge and Underperformance

What do I mean? The fact that miners plunged recently and that they have been underperforming gold for weeks (and for many months from the long-term point of view).

Moving back to silver, in today’s pre-market trading, the white precious metal moved to new yearly lows.

Silver Chart
Silver Chart

This is a completely normal and unsurprising phenomenon, and you knew about the reason behind it for quite many days.

Silver not only broke below its rising support line, but by doing so, it completed its head-and-shoulders top formation. Those formations tend to be followed by pauses, corrections, and/or verifications that take form of a comeback to the previously broken neck level of the pattern. Once this is all done, the price then slides.

That’s exactly what we saw in the previous days. Silver consolidated below the pattern’s neck level, even trying to move back to it, and then it declined. This decline has been continuing up to this day.

Further Fall for Silver

Moreover, this short-term decline is most likely not over yet, as the target based on the pattern is close to the 2023 low – at about $21. This means that silver is likely to fall further.

And speaking of the head-and-shoulders patterns in the precious metals sector, we see it as well in the junior mining stocks.

GDXJ Hourly Chart
GDXJ Hourly Chart

The area marked with an orange rectangle is also a head-and-shoulders top pattern. The neckline (marked with an orange, dashed line) was broken, and the VanEck Junior Gold Miners ETF (NYSE:GDXJ) has been consolidating after the breakdown.

Even though gold (and stocks.) moved higher in the short term, miners didn’t follow. This means that miners have been – once again – weak relative to gold on top of verifying their own breakdown.

This is a perfectly bearish combination that tells us that miners are about to slide once again.

Miners’ lack of rally on Friday is exceptional (-ly bearish) given that the S&P 500 just moved to new highs.

Just imagine how far miners would be likely to slide once the stock market plunges in a decisive manner.

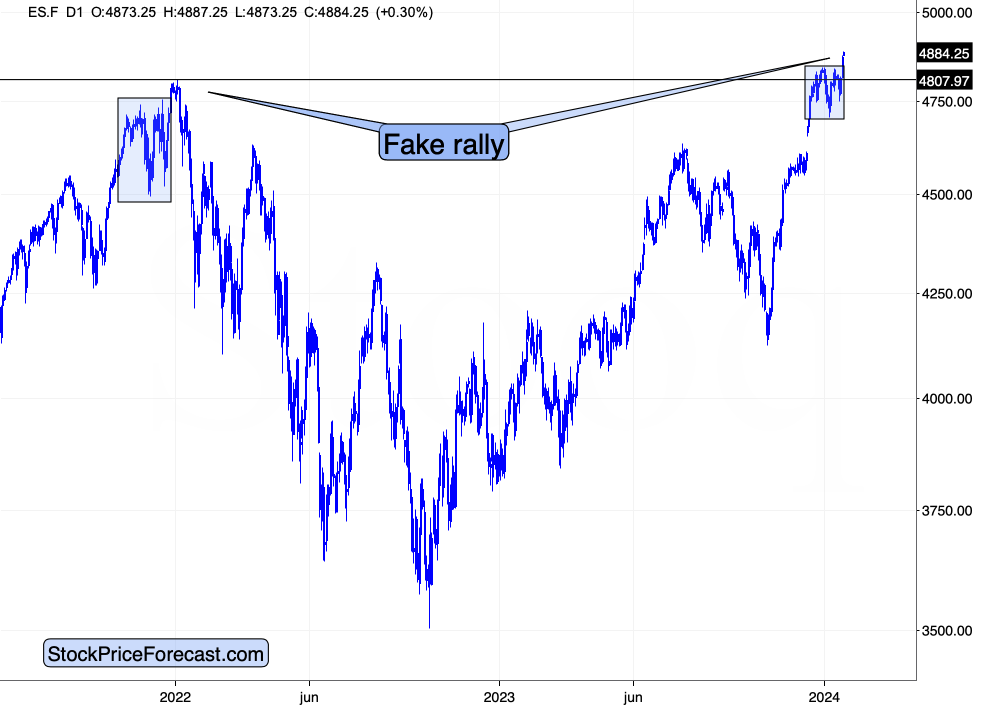
And we might not need to wait for that for much longer, either. If you look at the most recent trading pattern and compare it with what we saw at the end of 2021 and in early 2022, you’ll see that it’s the same kind of price movement.

In both cases, we saw two local tops along with two higher lows and then a sharp rally to new highs, which turned out to be the final top.

We saw the two local tops with two higher lows (so, we saw a consolidation), and on Friday we saw a sharp rally to new highs. Is this a final top? I view that as a likely outcome, especially given that commodities (like copper and silver) are not performing well. Also, have you seen that huge plunge in natural gas?

Weak commodity prices suggest that there’s no significant industrial demand, which is connected with insufficient demand for products coming from many companies. This, in turn, indicates weaker sales, revenues and profits. This means lower stock valuations.

Something doesn’t add up, especially since credit is still relatively expensive compared to what the markets were used to – the interest rates haven’t fallen.

When stocks decline in a meaningful way – and they are likely to – silver and junior mining stocks are likely to be affected to a particularly high extent. And – as you can see in today’s pre-market trading – silver just can’t wait to move to new lows… New lows are most likely approaching in the case of miners as well, and it seems that profits on our short position in junior miners are going to increase shortly.

Silver’s Leading the Way to New Yearly Lows
 

Related Articles

Silver’s Leading the Way to New Yearly Lows

Add a Comment

Comment Guidelines

We encourage you to use comments to engage with other users, share your perspective and ask questions of authors and each other. However, in order to maintain the high level of discourse we’ve all come to value and expect, please keep the following criteria in mind:  

  •            Enrich the conversation, don’t trash it.

  •           Stay focused and on track. Only post material that’s relevant to the topic being discussed. 

  •           Be respectful. Even negative opinions can be framed positively and diplomatically. Avoid profanity, slander or personal attacks directed at an author or another user. Racism, sexism and other forms of discrimination will not be tolerated.

  • Use standard writing style. Include punctuation and upper and lower cases. Comments that are written in all caps and contain excessive use of symbols will be removed.
  • NOTE: Spam and/or promotional messages and comments containing links will be removed. Phone numbers, email addresses, links to personal or business websites, Skype/Telegram/WhatsApp etc. addresses (including links to groups) will also be removed; self-promotional material or business-related solicitations or PR (ie, contact me for signals/advice etc.), and/or any other comment that contains personal contact specifcs or advertising will be removed as well. In addition, any of the above-mentioned violations may result in suspension of your account.
  • Doxxing. We do not allow any sharing of private or personal contact or other information about any individual or organization. This will result in immediate suspension of the commentor and his or her account.
  • Don’t monopolize the conversation. We appreciate passion and conviction, but we also strongly believe in giving everyone a chance to air their point of view. Therefore, in addition to civil interaction, we expect commenters to offer their opinions succinctly and thoughtfully, but not so repeatedly that others are annoyed or offended. If we receive complaints about individuals who take over a thread or forum, we reserve the right to ban them from the site, without recourse.
  • Only English comments will be allowed.
  • Any comment you publish, together with your investing.com profile, will be public on investing.com and may be indexed and available through third party search engines, such as Google.

Perpetrators of spam or abuse will be deleted from the site and prohibited from future registration at Investing.com’s discretion.

Write your thoughts here
 
Are you sure you want to delete this chart?
 
Post
Post also to:
 
Replace the attached chart with a new chart ?
1000
Your ability to comment is currently suspended due to negative user reports. Your status will be reviewed by our moderators.
Please wait a minute before you try to comment again.
Thanks for your comment. Please note that all comments are pending until approved by our moderators. It may therefore take some time before it appears on our website.
Comments (4)
Peter Cooper
Peter Cooper Jan 24, 2024 5:57AM ET
Saved. See Saved Items.
This comment has already been saved in your Saved Items
Gold is poised for a major breakout, and anybody shorting silver is being hammered today. The stock market is rising on the thought of a tax cutting, tariff raising Trump presidency. Remember how gold shot up from January to August in 2020 during the last presidential race? And in 2016 BTW.
Kelvin Kigome
Kelvin Kigome Jan 23, 2024 7:25PM ET
Saved. See Saved Items.
This comment has already been saved in your Saved Items
personally I use the coffee faming method to harvest Gold pips...
Tom Scheuermann
Tom Scheuermann Jan 22, 2024 10:52PM ET
Saved. See Saved Items.
This comment has already been saved in your Saved Items
if you look at the pattern since 2020.....I mean, even if you look at a 20 year chart for gold.. all TA should point higher. you have multiple bullish patterns in basically any time frame. if your bearish on gold right now, IMO you're in the path of a steamroller picking up pennies. cup in handle in a cup in handle in a bullflag and R H&S continuation pattern etc etc. if gold made a major move down right now it would invalidate, as PR likes to say, like the last 25 years of price action.
Tom Scheuermann
Tom Scheuermann Jan 22, 2024 4:22PM ET
Saved. See Saved Items.
This comment has already been saved in your Saved Items
whites lead yellow is not a saying about the pm market. you're just making stuff up now. everyone knows that gold leads the market vs silver. silver makes more dramatic moves but direction is decided by gold. I stopped reading after that nonsense.
 
Are you sure you want to delete this chart?
 
Post
 
Replace the attached chart with a new chart ?
1000
Your ability to comment is currently suspended due to negative user reports. Your status will be reviewed by our moderators.
Please wait a minute before you try to comment again.
Add Chart to Comment
Confirm Block

Are you sure you want to block %USER_NAME%?

By doing so, you and %USER_NAME% will not be able to see any of each other's Investing.com's posts.

%USER_NAME% was successfully added to your Block List

Since you’ve just unblocked this person, you must wait 48 hours before renewing the block.

Report this comment

I feel that this comment is:

Comment flagged

Thank You!

Your report has been sent to our moderators for review
Continue with Apple
Continue with Google
or
Sign up with Email