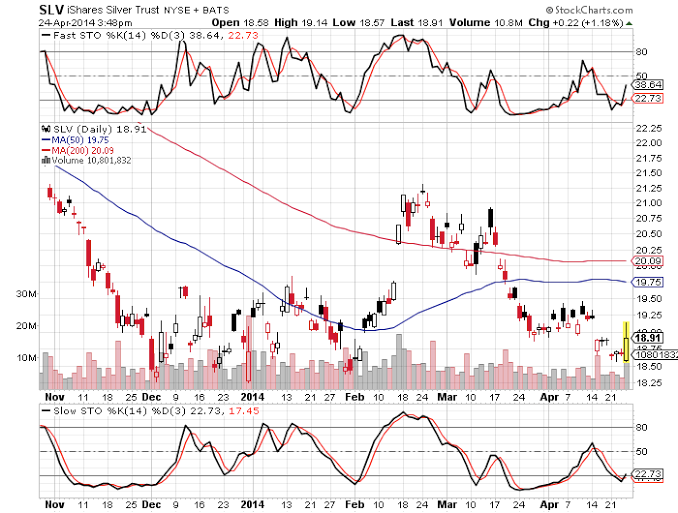
The iShares Silver Trust (ARCA:SLV) is putting in an outside day upside reversal, as is gold.
Most importantly, as is evident from the 6-month SLV chart below, the slow stochastic has provided a powerful divergence. Gold has done the same, though it is glaring in the case of silver. Note how much lower the SLV was when the stochastic made its higher low this week. For a confirmed buy signal, the stochastic need only cross 20 to the upside, which should be the case tomorrow (Friday).
A truly fascinating technical aspect (which supports the anticipation of an explosive upside run-up) is the fractal analysis that demonstrates multiple A-B-C and 5-wave subdivisions down since 2011, right into this week's low.
In other words, this thing has stretched its pattern lower, as much as it has stretched investors worn out nerves. I mean, we even see a final 5-wave move of C that took the metal into a last gasp lower (this historic week), which rarely (and I do mean rarely) happens.
My first precious metals-related report very strongly urged investors and speculators to acquire the 2016 calls, which, when coupled with outrageously low premiums (that report included a study of the CBOE Silver Etf Volatility, which reflects SLV option premium levels) provided and provides an historic opportunity to create great wealth, even if one just held and did not modify positions at critical SLV price or VXSLV premium levels.
Aside from lining up an amazing opportunity mathematically, it reflects the psychology of exasperated investors at these stretched out lows. The SLV price, along with its premium levels create an historic double-whammy.

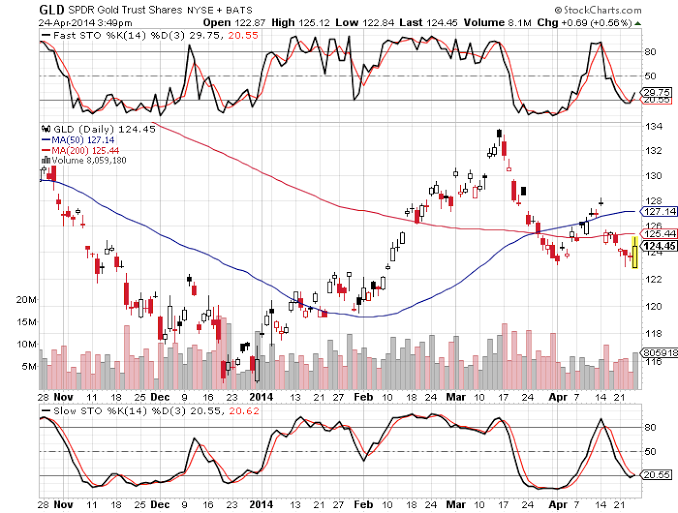
The second chart, the 6-month look at the SPDR Gold Trust (ARCA:GLD), reflects the same, though more subtle, slow stochastic divergence. As explained in prior reports, the slow stochastic divergence is my favourite and most reliable indicator.

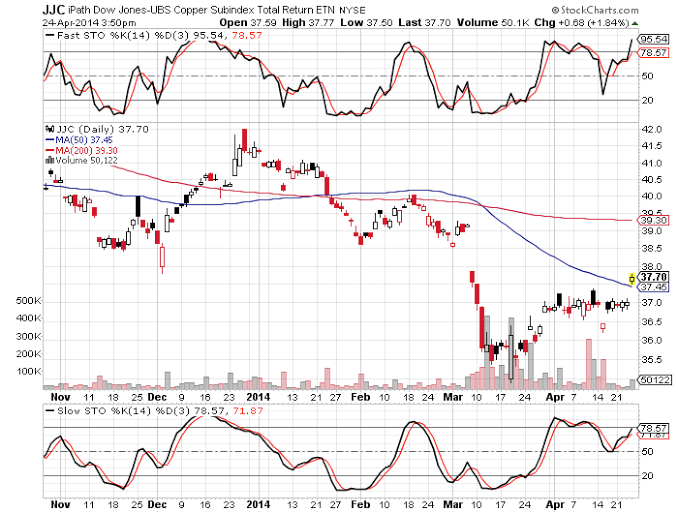
When looking at the 6-month iPath DJ-UBS Copper Subindex TR (JJC) chart, we see that its slow stochastic (and price) is at the other end of the spectrum (overbought) and could reverse lower, while simultaneously putting in a bearish divergence at such lofty levels.
To boot, the pattern is setting up a bearish expanding triangle, so, all taken together, even if the inflation tide has turned, copper could suffer a smashette to put in a higher low, even if not a new one.
Simply, the ratio trade merits a little bit more patience, bearing in mind that taking a small loss would very likely be an extremely positive event for precious metals.
For silver bulls, such an event as would be caused by extremely robust action in copper would suggest that inflation is rearing its ugly head in a "socially acceptable manner." In other words, the governments can no longer conceal the prices at the supermarket.
Either way, I look for the crowd to turn toward precious safety, as opposed to any economic plays, since that is what copper is largely seen to be for now. Simply, silver is the safest inflation play, as it doubles as a safe haven.

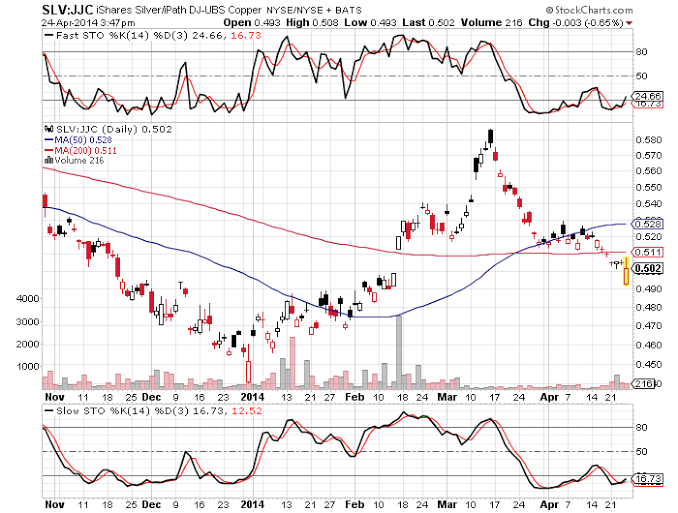
The 2nd precious metals-related report advised going long the SLV:JJC ratio, with a stop at .49.
I would like to clarify that the stop should be on a close-only basis and further remind that the position was/is a small limited risk trade for the purposes of hedging the very long term and super leveraged SLV call, in the event that copper were to ever break down to make new lows again.
The ratio's 6-month SLV:JJC ratio chart illustrates the same oversold reading that is bullishly crossing 20. In conjunction with the interpretation of the JJC stand-alone chart immediately above, the set-up may be one that is very bullish for silver.
Our two strategies in tandem suggest balance and leverage that is ready for what may come next within any silver-favourable scenario.

From Elliott to momentum and beyond, the bullish technical story is a long one, while the fundamental one is even longer, and, fittingly, just as bullish.
Make money.
