Precious metals have begun Wave-3 to much higher levels, as forecast last week in these pages. However, Wave-3 will have subdivided to include a wave-2 correction, which, by definition, will be followed by wave-3 of 3, the most powerful advance.
The above article focused on a super-leveraged long term silver strategy, due to a coincidental low in premiums as a double-whammy. The research also contemplates the possible effect of a copper correction, since this would contribute to a further pause in silver's acceleration to much higher levels.
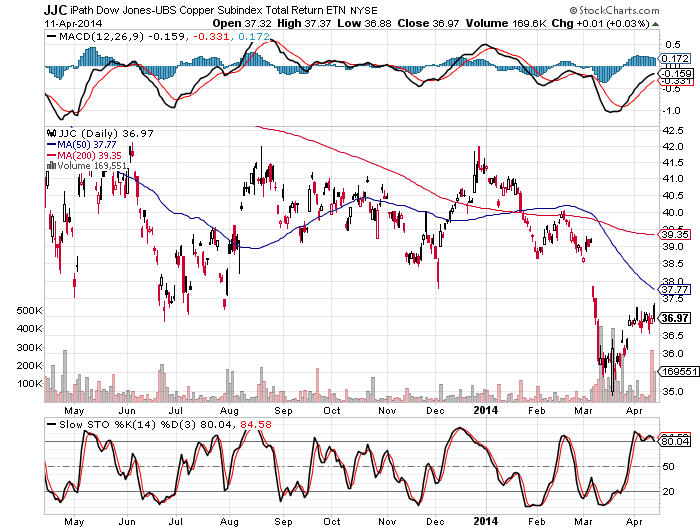
Indeed, as the 1-year iPath DJ-UBS Copper Subindex TR (JJC) below plainly illustrates, the slow stochastic, my most reliable technical indicator, bearishly diverged at this past week's peak (MACD appears above price chart). Therefore, it is likely that copper will indeed correct, as per last week's concern.

However, silver, which is pulled by both copper and gold, is at the other end enjoying an upward sloping slow stochastic. Simply, even if copper were to decline, silver should still rally, though not as much as it would otherwise.
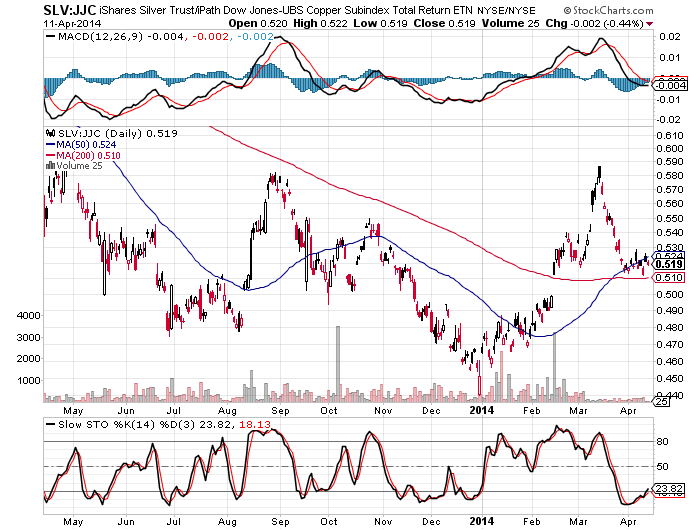
Therefore, please note the following 1-year SLV:JJC ratio chart.
As with the GLD chart (see linked article above), this picture illustrates a clear 5-wave (impulsive) advance, which has (1) corrected 50% of its advance (2) all the way to its neckline, simultaneously (3) forming the right shoulder of a reverse shoulder-head-shoulder formation. As well, (4) the slow stochastic provided a bullish divergence at the price chart's low.
All taken together is very powerful.

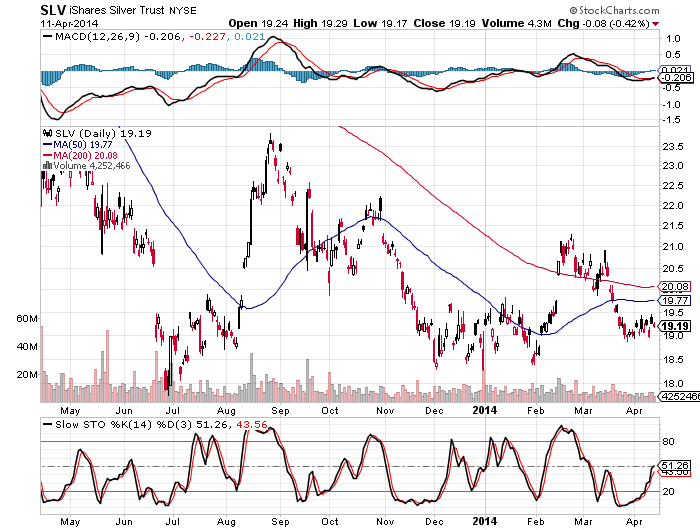
The iShares Silver Trust (ARCA:SLV) 1-year chartat the bottom reflects a finally-upward-sloping 200-day moving average (red line), while the slow stochastic is speeding higher.
The slope of the stochastic's advance suggests that it will run out of steam and, as short term momentum therefore wanes, wave-c of 2 should get underway, thereby setting the stage for the dramatic advance in the PMs. (The SLV's technical interpretation and wave count are the same as the SPDR Gold Trust (ARCA:GLD)'s, as per the above-referenced article.)
Later, this will have been taken as a clear lead indicator of accelerating and finally admitted inflation, a reality to which any shopper can attest.
STRATEGY
The final takeaway for any investor should be this:
When inflation becomes evident and its ongoing reality finally becomes psychologically accepted, the confluence of this fact with gold's own Wave-3 rally will erupt silver in its historically manic fashion. Simply, silver will click on all cylinders as even copper kicks in to the upside, no longer serving as a drag.
Ergo, make use of the strategy contemplated in the linked article at the beginning of this piece, using it as a central speculation, as well as a strategic portfolio hedge against equity positions.
As regards the SLV:JJC ratio chartabove, the principal strategy to which this report is dedicated, I advise a 100% long position, with a stop at .49.
It is worth noting that a speculator could view this strategy as a hedge of to the recommended long call position, should copper totally break to new lows, since such an event would pause the silver advance. Historically, copper bottoms after silver.

