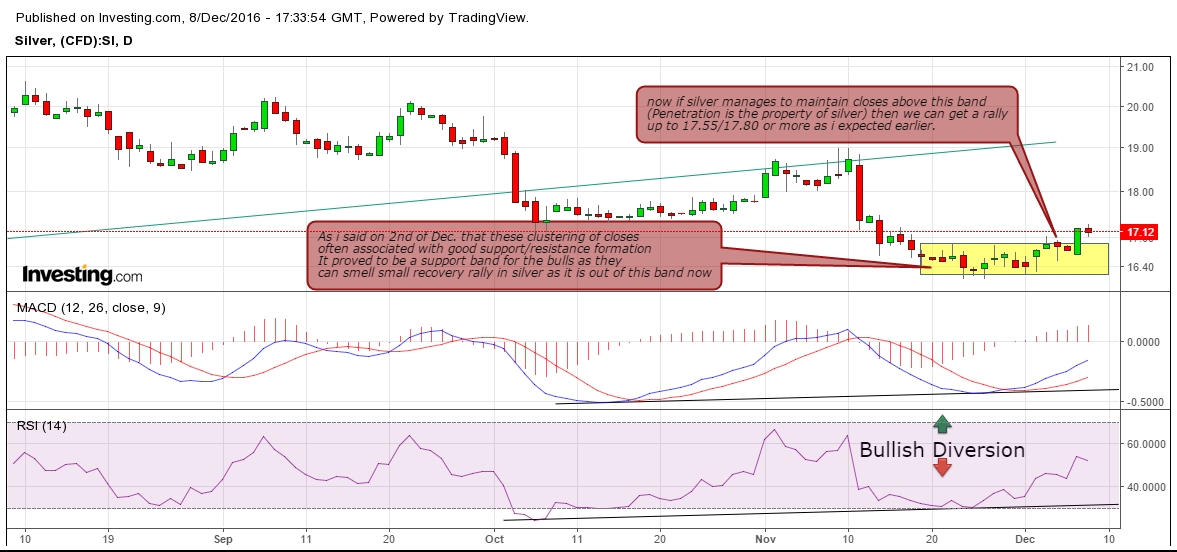
Here is what what i said on 8th December-
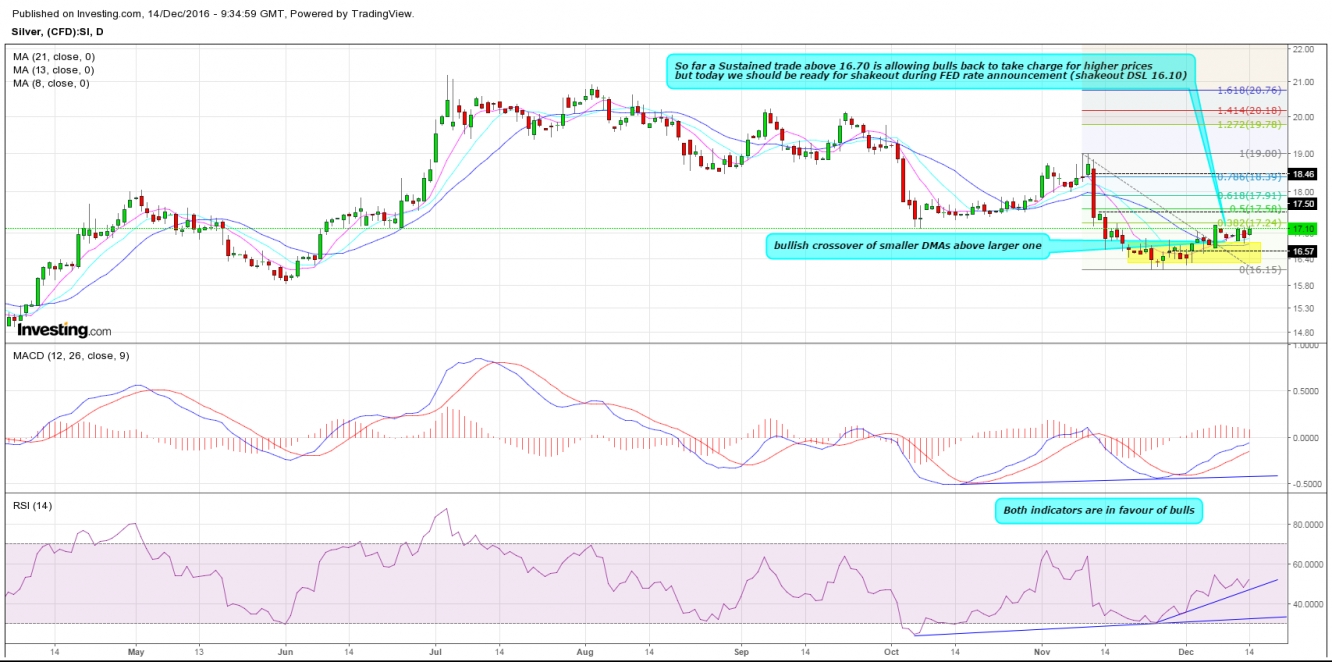
The daily chart regenerated again below.
Silver did a high of 17.30 so far and right now trading at 17.10. nothing much has changed except silver has started to close above our congestion box and even it not penetrated the previous congestion zone, definitely looks bullish right now. Here is the daily chart below which is in favour of bulls before FED Rate decision. any weakness towards 16.60-16.50 should be an excellent buy opportunity with reversal below 15.80.
The complete picture will just invert below 15.80 and hence is the reversal point. Personally, i believe that we should see the upper levels in this white sleeping giant.
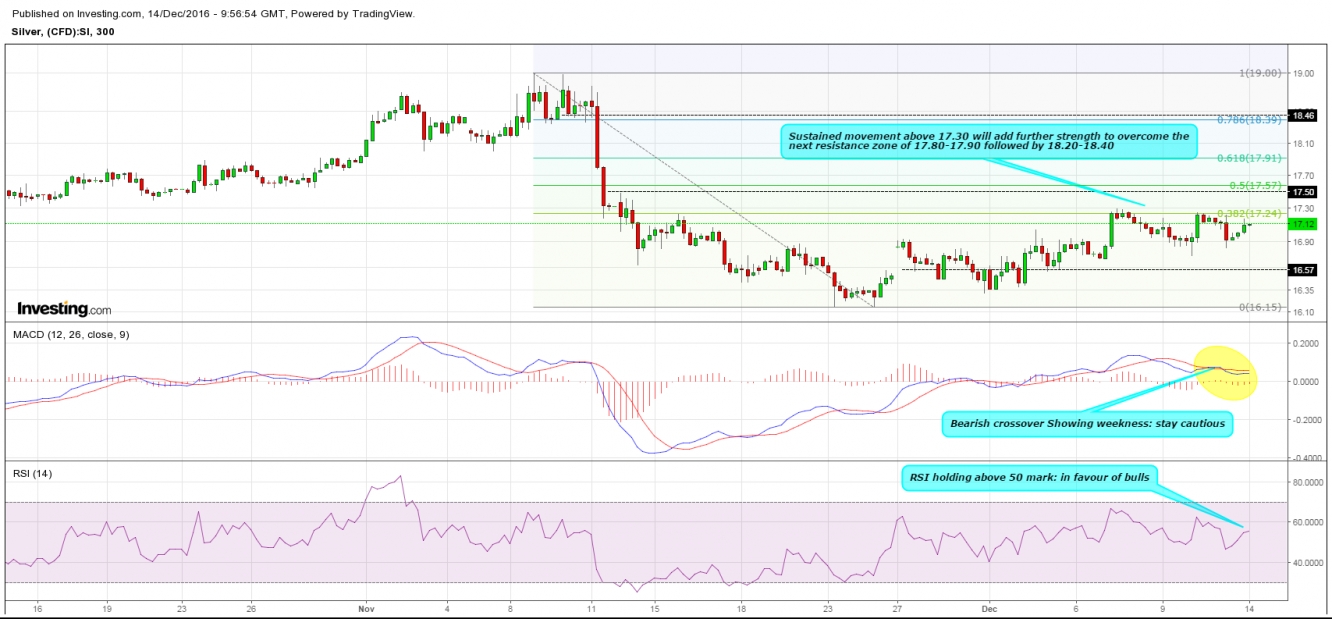
Here is the 5 hr chart below which argues for a caution ahead as MACD has given a bearish crossover which can induce a bearish move towards 16.60-16.50, hence it becomes more important for bulls to take out silver above 17.60. Based on the daily chart one should favour buy the dip strategy, sellers stop is now 17.60, above 17.60 it can move towards 17.80-17.90 zone which if clears will give the way to strong resistance of 18.40$.
Buyers stop and last hope according to me is 15.80$ any close below 16.00-15.80$ will favour the bears to extend the prices lower somewhere around 13.30-12.75$, which if cleared then next support around 11.90 and finally 10.80$. It will be interesting to see who wins here to redirect the trend, of course i am sitting with bulls with reversal of 15.80.
Hoping the area of 17.80 followed by 18.40 or more.
Let's see who is rewarded by the market.......
Resistance: 17.60 / 18.00 / 18.40
Support : 16.60 / 16.15 / 15.80


