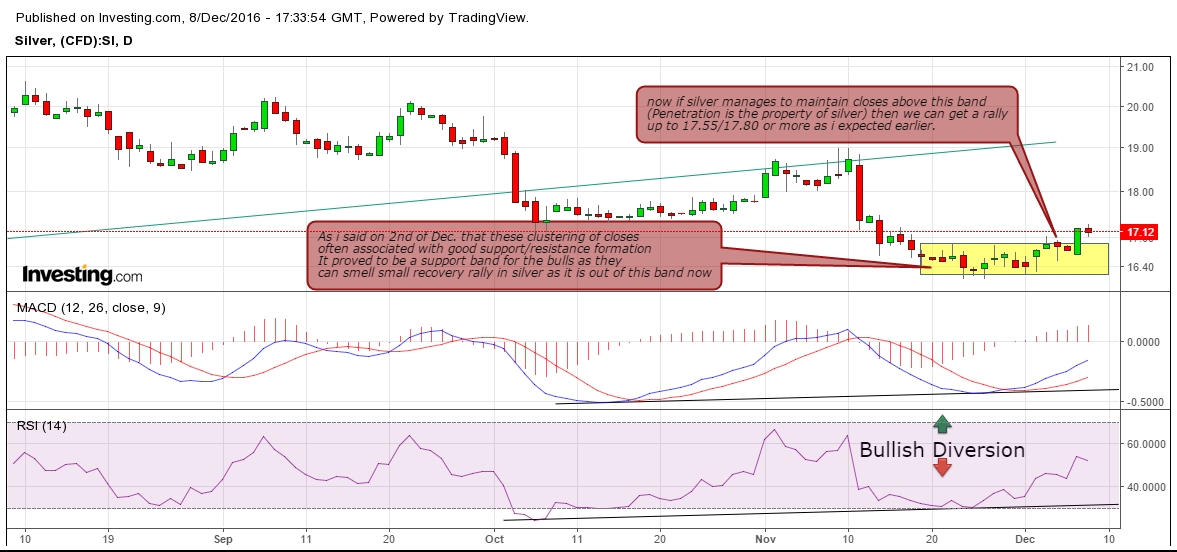
This is the daily chart of silver showing some hope for bulls
Here is what i expected on 2nd of December.
So far it has managed to overcome the congestion zone only, still the job is half done for bulls. Technically silver is looking good from the risk reward ratio perspective. I am with bulls for 17.55 followed by 17.80 and more, but there is something for bears also. What if it fails to hold the support zone, we should also be ready for the worst case also.
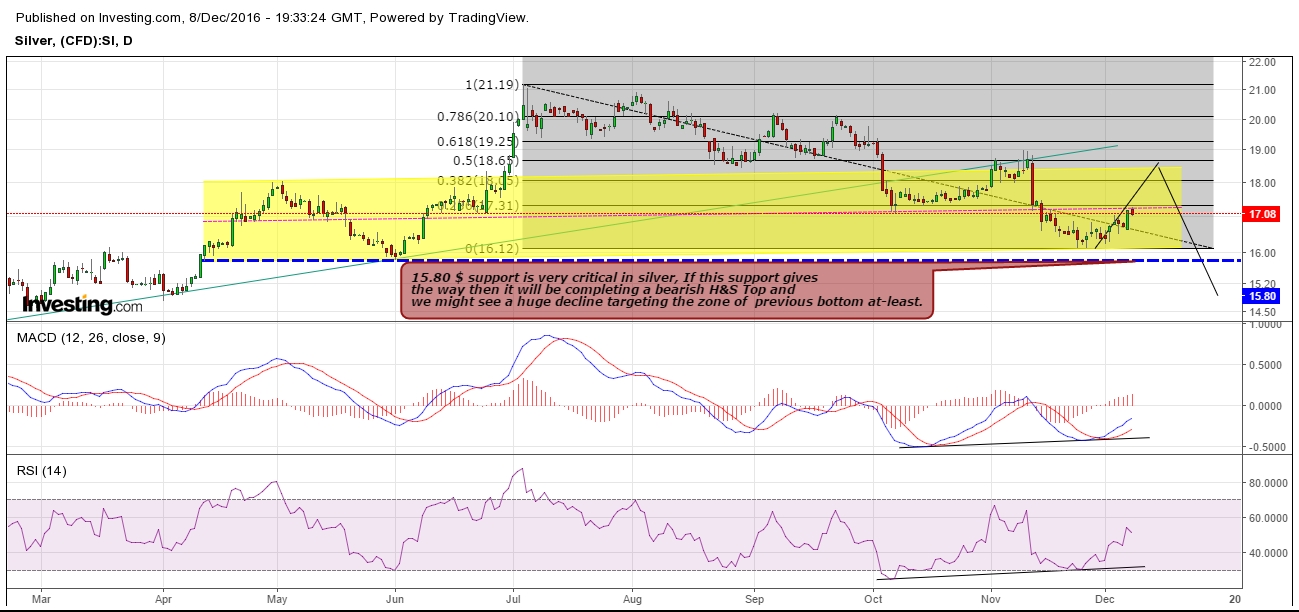
Look at this daily chart and you will get that why everyone is looking for this 15.80$ support area, actually it might prove to be an imaginary neckline for possible H&S pattern if it becomes the reality. If it happens and silver really breaks 15.80 then the targets of this pattern will be 13.30 at least (just below the bottom area) and if this area fails to hold then following figures are 12.70 / 11.80 and finally 10.80$
So trade cautiously and with strict stops below 15.80. Being in a bull camp, I would like to see the failure of this pattern but this will be decided by the market as there is no place for hopes here.
Now if this pattern fails then we will see 26$ definitely within few weeks.
Resistance: 17.55/17.80/18.2
Support: 16.8/16.30/15.80


