About a week ago, as gold rallied into the $1170 – $1190 area, the roadmap I laid out for gold was “first a scary drop, and then an upside pop”.
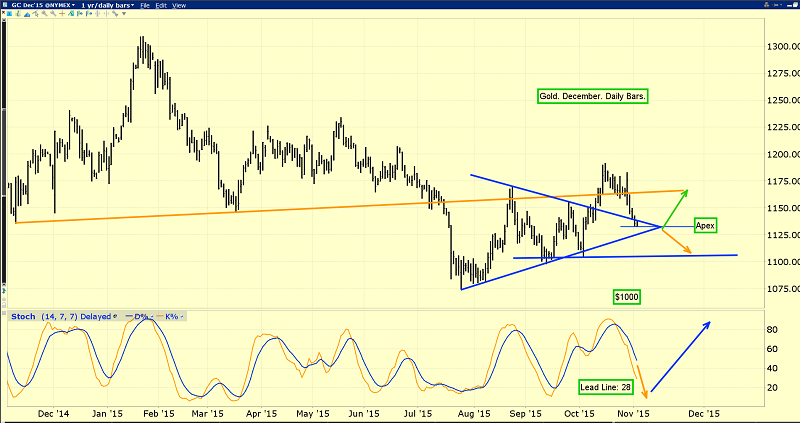
That’s the daily gold chart. I suggested gold would quickly decline to the $1130 apex area of a beautiful symmetrical triangle, and that’s exactly what has happened. Gold is trading at about $1131 this morning.
What caused the decline? Well, from a fundamental perspective, gold has a rough general tendency to decline ahead of the US jobs report. In the bigger picture, gold tends to move in response to the ebb and flow of Indian gold jewellery demand versus supply.
The current decline from the $1190 area to about $1131 can mainly be attributed to these factors, and also to Janet Yellen’s stubborn refusal to make a firm commitment to a rate hike.
The gold market is looking for consistency and transparency. It’s getting it from the Chinese and Russian central banks, but not from the Fed. As a result, there’s a risk that gold declines to the $1100 - $1120 area, before Friday’s US jobs report is released.
Note the position of my 14,7,7 series Stochastics oscillator, at the bottom of the gold chart. The lead line sits at about 28 this morning. It should be in the 20 area by 8:30 AM on Friday, when the US jobs report is scheduled for release.
That’s good news for all gold price enthusiast. The technical and fundamental “stars” are lining up very nicely, for a sharp post jobs report rally!
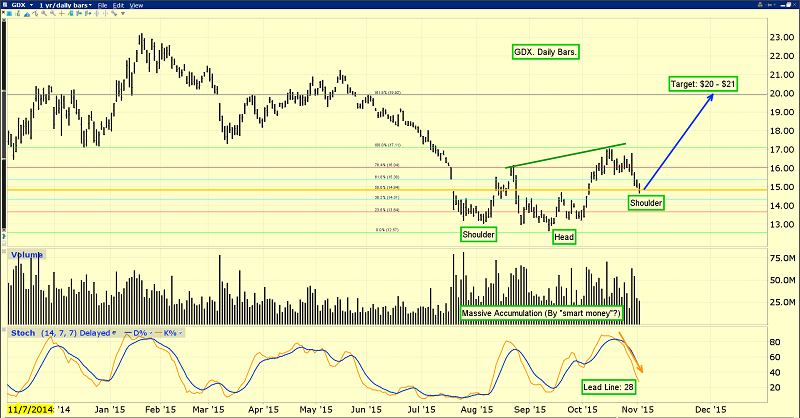
That’s the daily Market Vectors Gold Miners (N:GDX) chart. I asked the entire global gold community to give serious consideration to pressing their gold stock “buy button”, if GDX traded under $15. It did so, but only briefly, yesterday.
This decline was needed, from a technical standpoint, to set up the right shoulder of an exciting inverse head and shoulders bottom pattern. The target zone of $20 - $21, pending a breakout above the $17 area, is roughly the 162% Fibonacci retracement line.
Gold stocks are probably now entering a “Goldilocks” type of situation, because a rate hike that causes a US dollar rally would benefit most of the world’s gold mining operations.
They produce gold in non-US currency, and get paid in US dollars.
A rate hike could also create a rally in both the dollar and gold bullion. That’s because modest rate hikes would add clarity to an unclear situation. Real rates (nominal minus inflation) could decline as Janet takes action, and money could flow out of real estate and into gold.
Bank loan activity would increase sharply with rate hikes, reversing the multi-decade decline in money velocity!
A rise in the bullion price would clearly benefit mining companies. In the current environment, which is the opposite of the 1979 environment, rate hikes are extremely bullish for most gold mining stocks!
I understand that a lot of gold stock investors switched to bullion from gold stocks, after the duties in India were implemented.
I think that “growth with safety” trade should now be unwound. Going forward, gold stocks are the better play than bullion, although from a system risk perspective, all investors should own a significant amount of both gold and silver bullion.
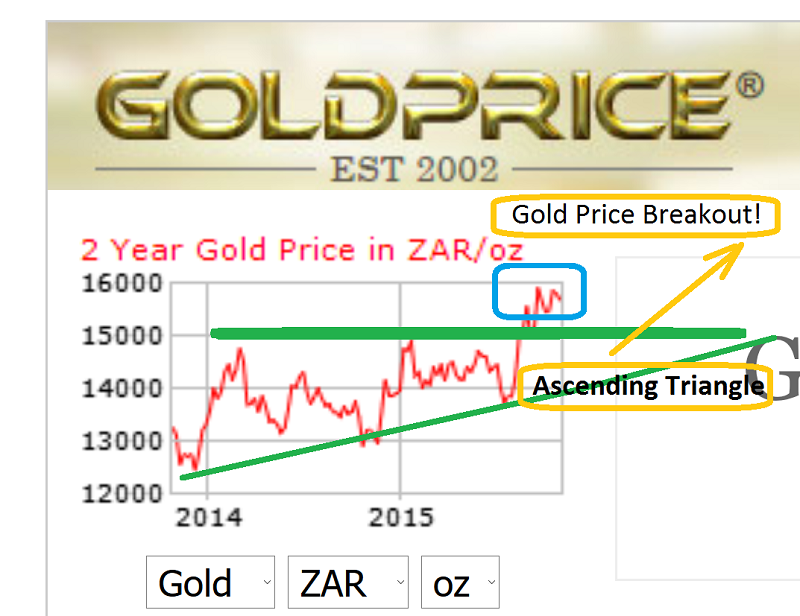
That’s a snapshot of the spectacular gold price action taking place in the South African rand. I realize that a lot of “old timers” in the Western gold community have some bad memories of strikes and other issues in South Africa in the 1970s and early 1980s.
I’ll dare to suggest that….times have changed! Chinese companies are becoming eager to invest in South African mines, and the dollar/rand rally has created a massive breakout in the local gold price. Note the beautiful ascending triangle in play on that chart. Australian engineers have been hired to help mechanize key mines in South Africa, and they still hold some of the biggest reserves on a per mine basis. That’s very attractive to Chinese players, who plan carefully for the long term!
My proprietary trading system at www.guswinger.com has generated about $54 per GDX share in trading profits since 2011, and done so while GDX itself has, unfortunately, slipped from about $55 to $15.
If Janet Yellen wants to get serious about repairing what is wrong with the Western world, she needs to move decisively towards a dual policy of modest rate hikes and modest gold revaluation. Rate hikes steer amateur investors away from dangerous “risk-on”equity and real estate markets, and towards bank accounts, where professionals can loan depositor money to small businesses. That boosts money velocity, which boosts GDP!
Rate hikes also put pressure on the ability of Western governments to borrow money, which they promptly waste on insane bombing and regime change programs in the Mid-East, and silly entitlements programs at home. A modest and fully transparent US government gold buy program, of just thirty tons a month, would quickly help end global deflation.
If Janet doesn’t want to revalue gold, it really doesn’t matter, because the central banks of China and Russia ultimately will do it for her, with their transparent and consistent monthly buy programs. It’s only a matter of time, and probably not much time, before India’s central bank announces a similar buy program, to stay competitive with its BRIC brethren.
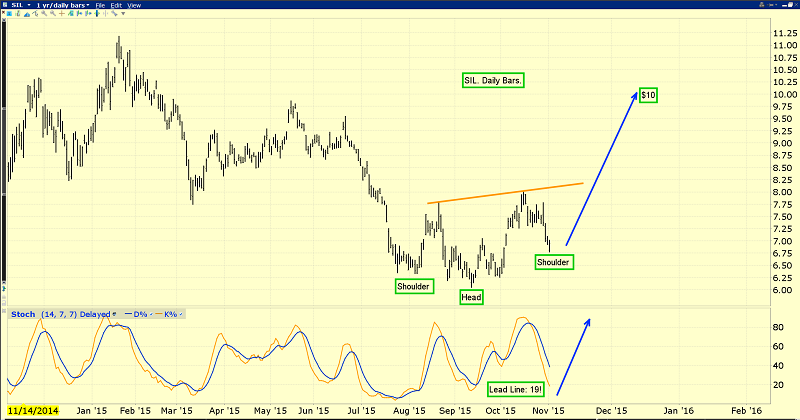
2016 is clearly setting up to be a wonderful year for gold stocks, and silver stocks look even better! That’s the daily Global X Silver Miners (N:SIL) chart, and quite frankly, it looks awesome. The short term upside implications are clear. Note the beautiful oversold position of my key 14,7,7 Stochastics oscillator at the bottom of that chart. There’s a very solid inverse head and shoulders bottom pattern in play. I’ve set the price target at ten dollars per SIL share.
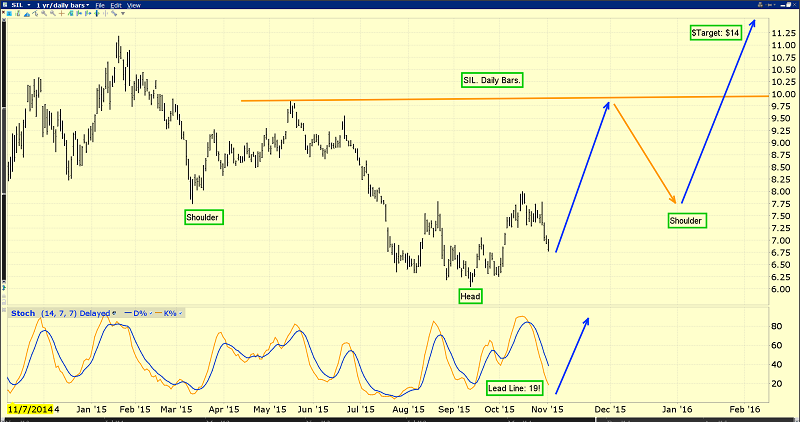
That’s another look at the SIL chart, and it’s clear that the first inverse H&S pattern could be morphing into the head of a vastly bigger one! Is the enormous silver demand growth in India creating this pattern, or is it the potential for substantial Western reflation? I think both catalysts are in play, and silver stock investors around the world are poised to benefit, in a very big way!
Thanks!
Written between 4am-7am. 5-6 issues per week. Emailed at aprox 9am daily.
Stewart Thomson is a retired Merrill Lynch broker. Stewart writes the Graceland Updates daily between 4am-7am. They are sent out around 8am-9am. The newsletter is attractively priced and the format is a unique numbered point form. Giving clarity of each point and saving valuable reading time.
Risks, Disclaimers, Legal
Stewart Thomson is no longer an investment advisor. The information provided by Stewart and Graceland Updates is for general information purposes only. Before taking any action on any investment, it is imperative that you consult with multiple properly licensed, experienced and qualified investment advisors and get numerous opinions before taking any action. Your minimum risk on any investment in the world is: 100% loss of all your money. You may be taking or preparing to take leveraged positions in investments and not know it, exposing yourself to unlimited risks. This is highly concerning if you are an investor in any derivatives products. There is an approx $700 trillion OTC Derivatives Iceberg with a tiny portion written off officially. The bottom line:
Are You Prepared?
