Gold is the world’s ultimate asset. So, even when nothing important is occurring in the market, investors can experience “ultimate greed” or “ultimate fear”.
Because the quality of the asset is so high, it’s crucial that investors are emotionally able to buy gold when uncertainty or even outright fear is present.

That’s the latest COT report for gold, and the huge buildup of commercial bank short positions can cause
significant nervousness among amateur gold investors.
That’s because these short position buildups are often followed by somewhat violent price declines. History has shown that these declines are solid buying opportunities for courageous gold investors.
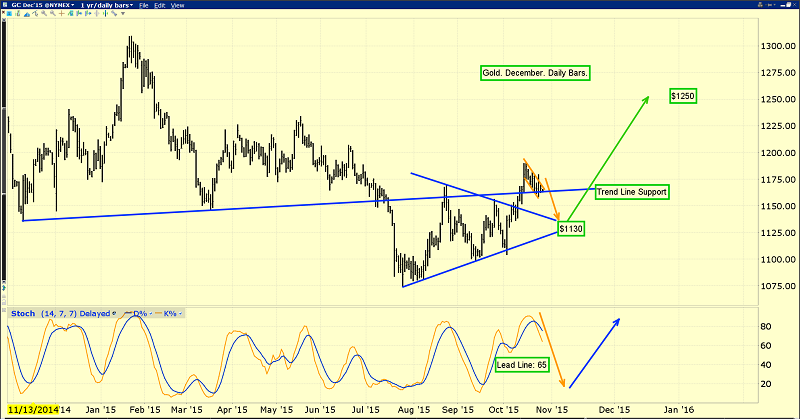
That’s the daily gold chart, and the technical situation is superb.
Gold burst upside from a symmetrical triangle pattern, as I predicted it would, and a painful pullback to the apex (about $1130 in this case) is typically the next technical event to occur.
The banks are likely anticipating this pullback, and adding short positions to profit from it. Gold is showing tremendous resiliency after the breakout.
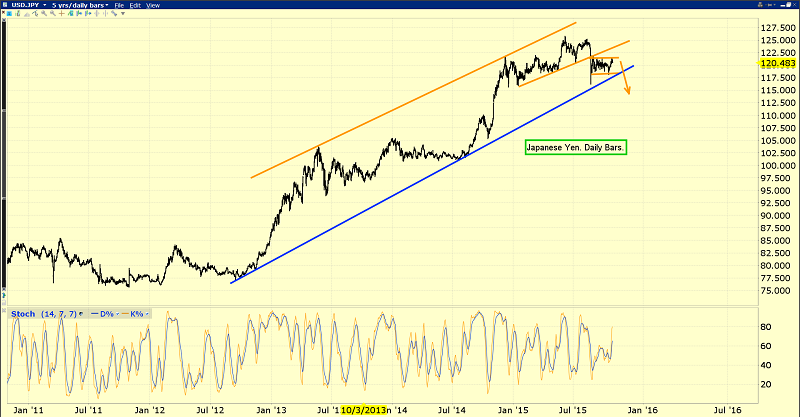
The US dollar versus Japanese yen chart is used by FOREX traders as a key lead indicator for gold prices. The dollar is beginning to look a bit shaky on this daily bar chart.
Janet Yellen has tapered the QE program to zero, while her Japanese counterpart has engaged in aggressive QE, but the dollar has lost momentum against the yen anyways!
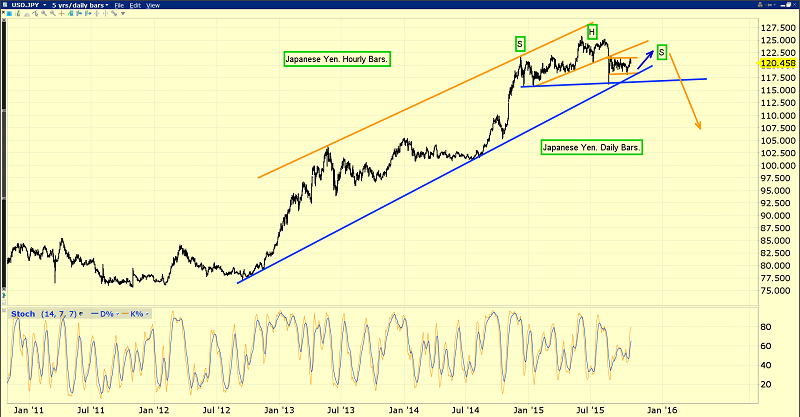
It appears that the dollar is carving out a huge head-and-shoulders top pattern against the yen, and a breakdown should initiate a massive rush into gold by top FOREX money managers.
It’s important to remember that during the August – September global stock markets mini crash, it was the yen, not the dollar, that acted as the world’s fiat safe haven of choice.
The gold-related news coming out of China is also very positive. The PBOC-controlled Shanghai Gold Exchange (SGE) is preparing to launch a gold price fix, and the PBOC itself has started a very transparent monthly gold buy program.
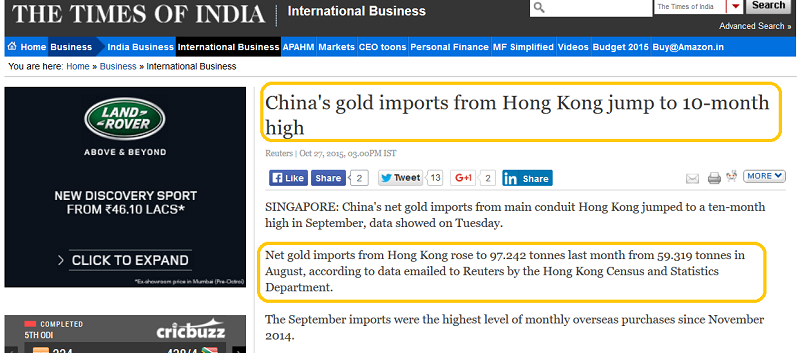
The sell-off in Chinese stock markets has had no effect on gold demand. Demand is rising again!
I’ve been a “lone wolf” advocate of the gold monetization program in India, as I’ve been an advocate of American rate hikes. Both are bullish for gold. Rate hikes will incentivize banks to make more loans, which will reverse US money velocity. In India, monetization is creating a “hallmarking stampede”. It’s boosting overall demand for gold, because consumers can now buy professionally hallmarked jewellery. That was hard to get before the monetization plans were announced.
The math is pretty simple; if Indian consumers were buying 19 carat jewellery with a 22 carat label on it before hallmarking became popular, they can buy a lot more gold now, for the same price they paid in the past.
Jewellers are incentivized to move more volume, which is a win-win situation for all stakeholders, including the mines the Western gold community is heavily invested in!
2016 should be a spectacular year for anyone involved with gold. While China is adding transparency to central bank operations in the gold market, India is adding transparency and to the gold jewellery market, and making the jewellery fungible.
Indian Dore bar imports are surging, and numerous Indian refiners are on the cusp of gaining LBMA certification for quality. The supply created by monetization is very small compared to the demand being created by the expansion of the jewellers.
The next FOMC meeting gets underway today, and Janet’s recent statements show her clear desire to see inflation move higher.
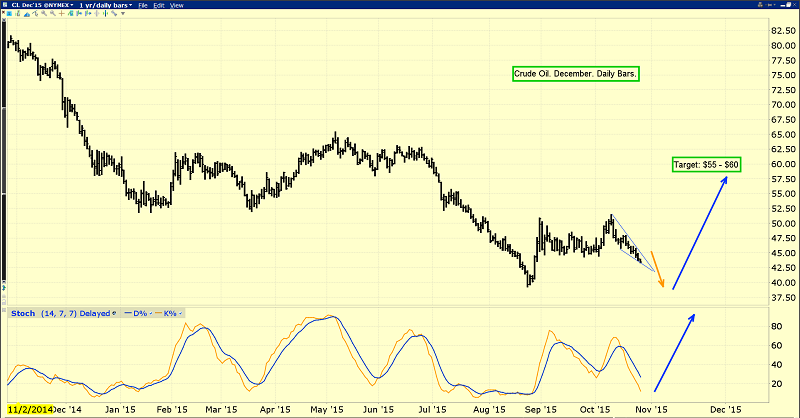
That’s the daily oil chart. Oil is the largest component of most commodity indexes, and Janet can’t be very happy about the price of oil. I expect her to make more references to the need to raise the level of inflation, at tomorrow’s FOMC meeting.
The good news is that oil appears to be forming a beautiful double bottom pattern. US rig counts are at a five year low, and oil investors are generally demoralized. In contrast I’m a happy buyer. I think 2016 will develop into a good year for oil, and for the broad-based commodity indexes.
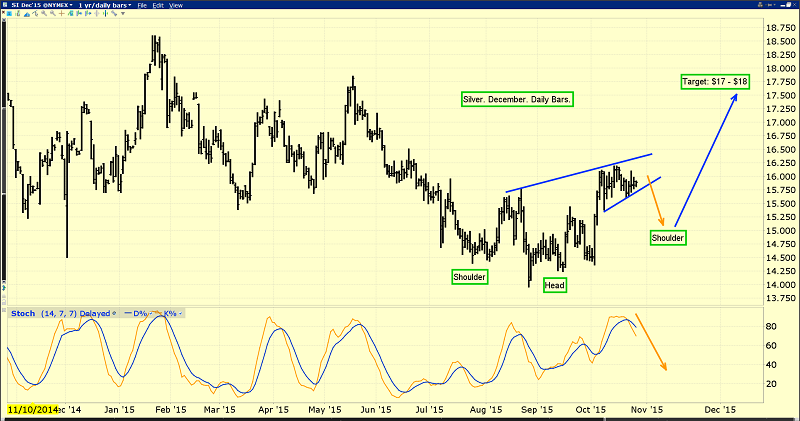
That’s the daily silver chart. There’s a very bullish potential inverse head and shoulders bottom pattern in play. A scary sell-off now would build the right shoulder, and set the stage for a nice move higher to ring in the New Year!
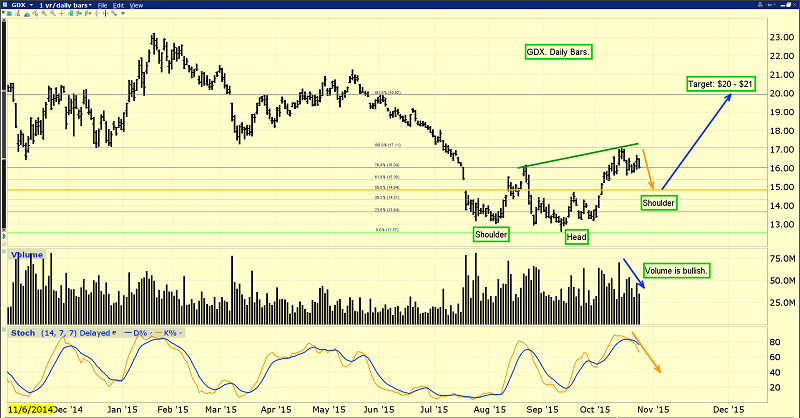
Gold stocks also are making investors nervous this week, but I think they also need a bit of a sharp drop, to complete patterns that are similar to what is on the silver chart. That’s the (N:GDX) daily chart.
A pullback to the $15 area, or a bit lower, would be very healthy price action. I predicted this was likely a week ago, and it seems to be in play now. Silver tends to perform better than gold when inflation is rising, and so do gold stocks. I think that’s very likely to happen, in 2016!
Written between 4am-7am. 5-6 issues per week. Emailed at aprox 9am daily.
Stewart Thomson is a retired Merrill Lynch broker. Stewart writes the Graceland Updates daily between 4am-7am. They are sent out around 8am-9am. The newsletter is attractively priced and the format is a unique numbered point form. Giving clarity of each point and saving valuable reading time.
Risks, Disclaimers, Legal
Stewart Thomson is no longer an investment advisor. The information provided by Stewart and Graceland Updates is for general information purposes only. Before taking any action on any investment, it is imperative that you consult with multiple properly licensed, experienced and qualified investment advisors and get numerous opinions before taking any action. Your minimum risk on any investment in the world is: 100% loss of all your money. You may be taking or preparing to take leveraged positions in investments and not know it, exposing yourself to unlimited risks. This is highly concerning if you are an investor in any derivatives products. There is an approx $700 trillion OTC Derivatives Iceberg with a tiny portion written off officially. The bottom line:
Are You Prepared?
