Long, Medium And Short Trends
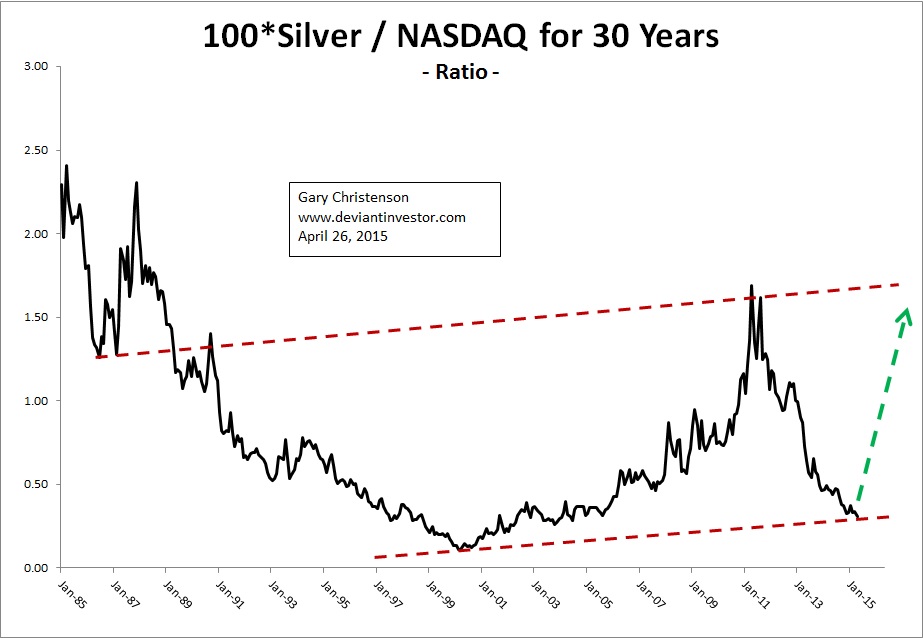
Courtesy of the High-Frequency-Traders and a wave of digital “money printing” the NASDAQ closed at a new high on Friday the 24 – a 15-year high. Silver, on the other hand, has been crushed – the near all-time high was 4 years ago this week. In this tale of two markets, we examine the silver to NASDAQ ratio over the long and medium term for clues about their next major moves.
Consider the ratio of silver to NASDAQ over 30 years. In 2011 the ratio was 1.69, while Friday’s close indicated a ratio of 0.31, a ten year low.

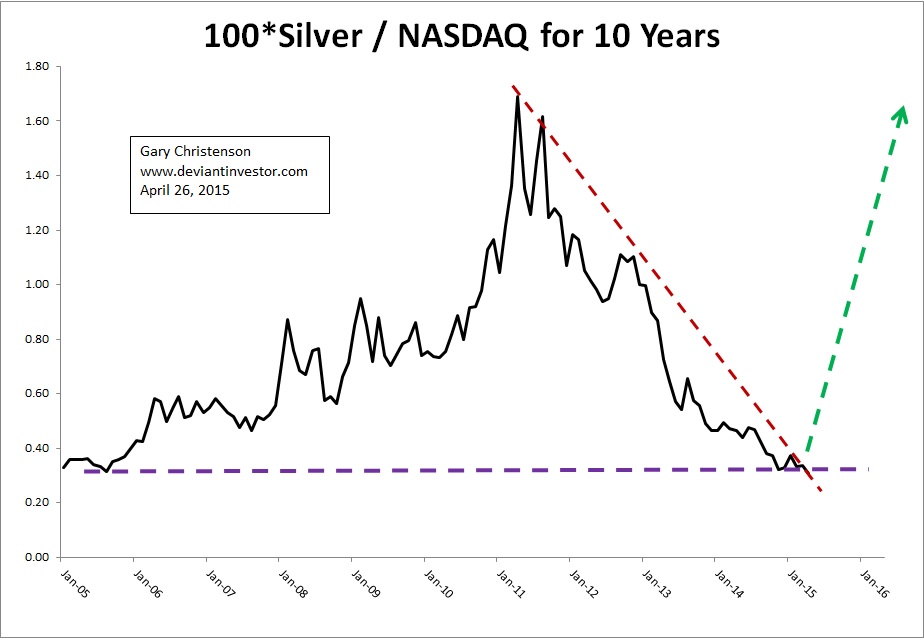
The ten-year graph of the ratio shows a hard decline since silver’s high in 2011. The ratio is currently quite low and while additional craziness is always possible, the more likely bet is for a reduction in the NASDAQ and a rally in silver, forcing the ratio higher.

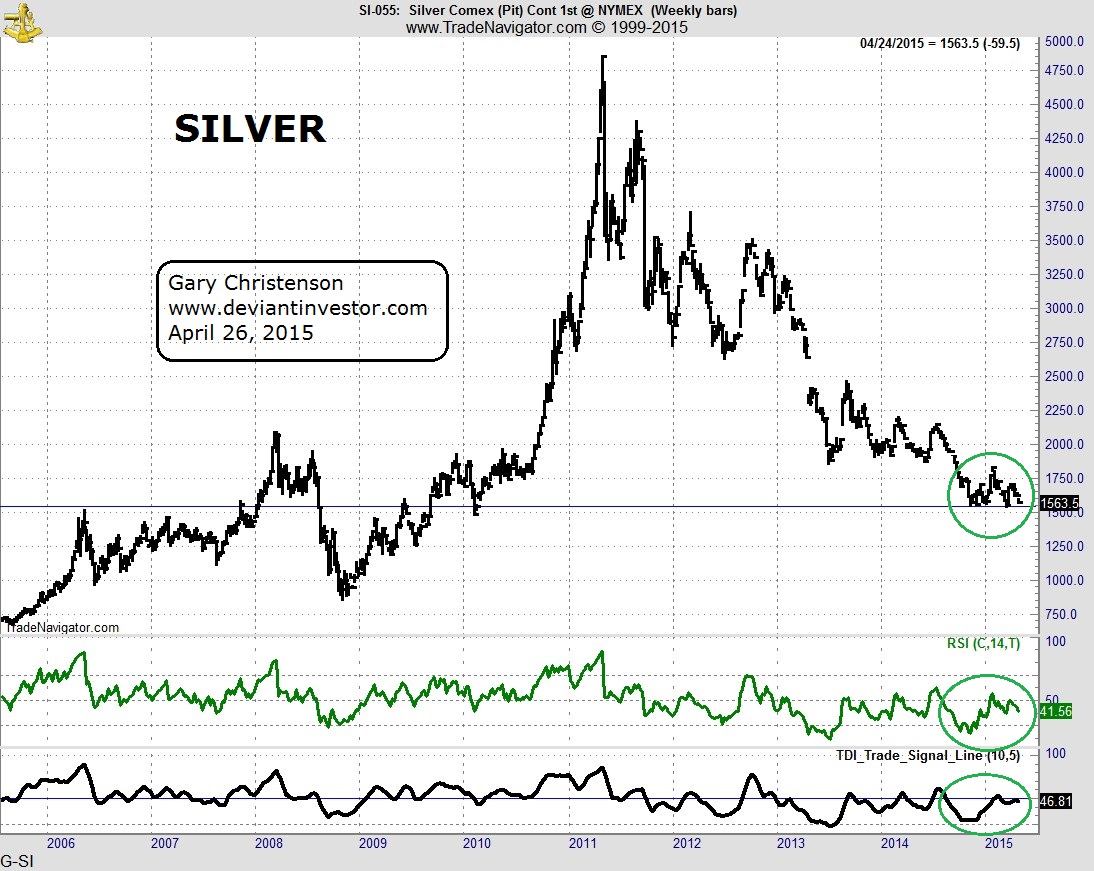
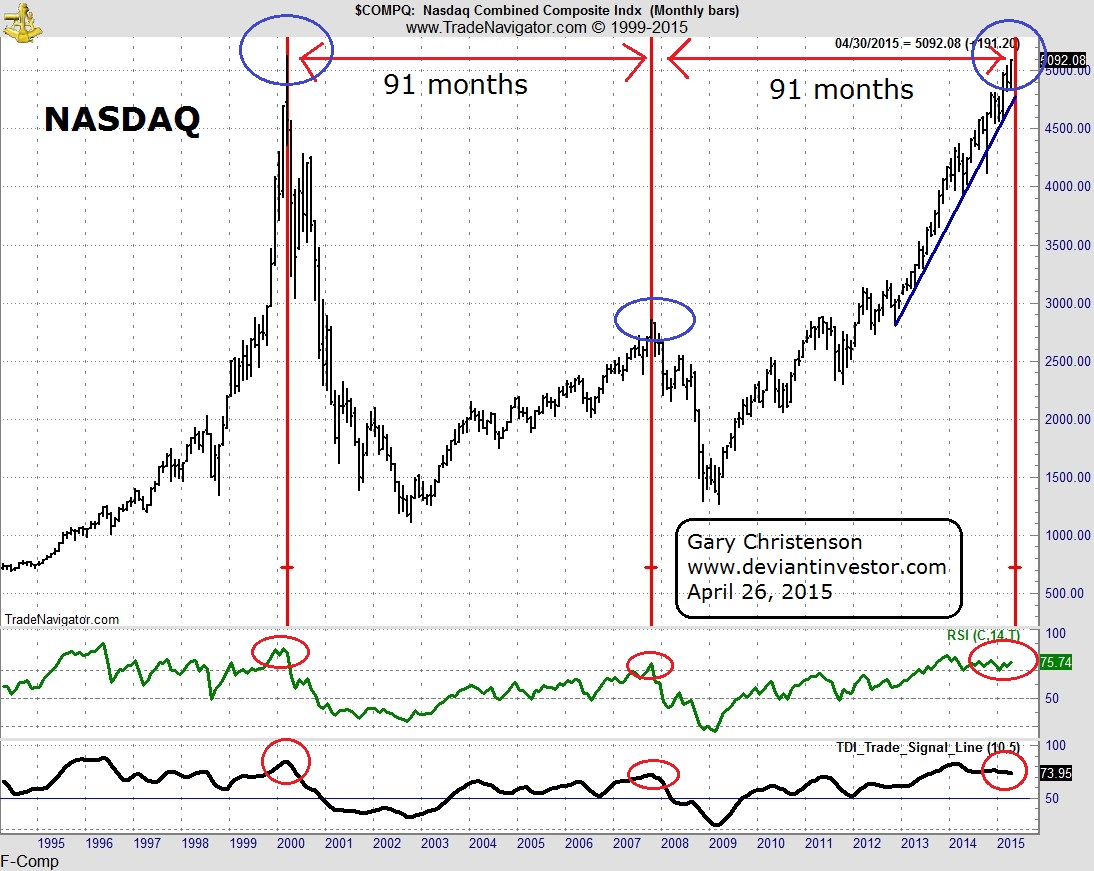
Shorter trends clearly show that silver is “over-sold” and has been for months, while the NASDAQ is quite high in what might be a “blow-off” rally. Note the 91 months between the NASDAQ high in 2000, the high in 2007 and the current high. That 91-month High-High-High cycle may be unimportant or it might indicate a significant and long-term high. Be cautious.


Silver has been forced lower since the April 2011 high and appears to have built a base around $15.00. I assume that both markets will correct their multi-year trends -- silver by rallying and the NASDAQ by falling.
I am not an investment advisor and I do not have an “approved by Wall Street” certificate so my views are my own. Do your own research, but in my opinion, now is NOT the time to be dumping savings into the NASDAQ when it is hitting a 15 year high. Instead, silver is at a 4-year low and has returned to 2006 levels. The risk/reward analysis strongly favors silver.
REMEMBER:
The US national debt is approaching $20 Trillion. Global debt is about $200 Trillion. Expect debt to increase substantially as central banks “print money” to continue blowing equity and bond bubbles.
Eventually people will recognize the “Ponzi-like” nature of the current bubble in debt based paper assets. Silver and gold will attract the attention of both intelligent and fearful investors.
If the debt bubble deflates, many of those paper assets will crash and burn. Silver and gold will shine in that environment.
Silver at $100 is coming, even though that milestone has been delayed by the “heroic” efforts of central banks and governments levitating paper assets and inflating the debt bubble.
Gold and silver are insurance – insurance against the devaluation of paper currencies, insurance against excessive “money printing” by central banks and corrupt politicians, and insurance against the inevitable collapse of fiat currencies.
It has been reported that over $5 Trillion in sovereign debt now “pays” negative interest. This does not inspire confidence in the viability of our current debt based financial system.
Silver and gold are antidotes to the poison of fiat currencies that are always printed to excess.
Read:
Steve St. Angelo, 105 Trillion Reasons to Own Silver
Jeff Thomas, What Will Happen When the Dollar Collapses
